High Cardinality Reports
Beginning April 26th we introduced a new, improved methodology for the way we handle high cardinality reports in SiteCatalyst and Discover. This change greatly improves your ability to understand the significant trends in your data. But before I dive into the nature of these changes and how they work, I want to give you a little background.
What is High Cardinality?
For the purposes of this blog post, a report has high cardinality when a “high number” of distinct values are passed in for given variable within a specific time frame. The variable may be page name, a prop, an eVar or any other standard or custom SiteCatalyst reporting dimension. So for instance, if you pass in millions of page names into SiteCatalyst each month, the page name variable has high cardinality. If you pass in millions of search terms via a Custom Traffic Variable (prop) each month, that variable also has high cardinality. There’s no specific line in the sand where a variable becomes highly cardinal per se, but for historical reasons we’ll state that any time a variable has more than 500,000 unique values in a month, the variable has high cardinality.
What does the data typically look like?
The graph in the figure below depicts a fictional (but realistic) example of the typical nature of high cardinality variables. This example uses the page names variable.

In this example, a customer passed in 1.1 million page names in a given month with a total of 560 million page views. I grouped the page names in buckets of various sizes based on the number of page views per page. The blue bars represent the count of page names for each bucket. For example, roughly 500 thousand of the 1.1 million page names had only one or two page views during the month. Likewise, about 19 thousand pages had 1,000 or more page views.
The green line represents the total page views for each bucket. You can see that the 19 thousand page names with greater than 1,000 page views accounted for 540 million of the 560 million total page views for the month! The other buckets accounted for the remaining 20 million page views.
I like to use the analogy of big rocks, medium-sized rocks, and sand. The items on the left-hand side of the chart are the big, important rocks. These are the pages you pay particular attention to. The items on the right-hand side of the chart are the sand. There are many, many pages in this group and each page has very little traffic. The medium-sized rocks fall somewhere in between.
What causes high cardinality?
****High cardinality can be caused by a number of factors:
- Sometimes it is the nature of the data. High cardinality may be a natural by-product of type of data you are collecting in the variable. For example, if you are collecting customer IDs in a prop, you may have millions of customers to track in a given month. Likewise, if you are using a variable to collect search terms, you may have millions of distinct search terms that are used during the month.
- Often a variable has unnecessary cardinality. Unnecessary or surplus cardinality can be caused in a number of ways. Poor/outdated implementations, lack of or non-adherence to naming standards, CMS problems, insufficient pre-processing of data and other factors can all contribute to unwanted cardinality. Page names are particularly susceptible to this problem, especially if you are using the URL as the page name. Query string parameters and session variables in a URL can quickly cause extreme cardinality and make the data very difficult to interpret.
- Sometimes SiteCatalyst itself contributes to high cardinality. Historically, traffic variables such as props have been treated as case-sensitive variables in SiteCatalyst. If you pass in the values “Home”, “home”, “HOME”, and “HomE” into a prop, these are considered four separate line items in SiteCatalyst reports. This creates unnecessary cardinality. eVars, on the other hand, are case-insensitive (i.e. case is ignored.) “Home”, “HOME”, “home”, and “HomE” are considered a single line item in reports and their metrics are aggregated together.
What is the impact of high cardinality?
High cardinality can have unwanted side-effects. First, reports and searches are slower, especially in SiteCatalyst 14 and earlier. But perhaps more importantly, unnecessary high cardinality can make it difficult to interpret and use the data. It’s hard to take action when there is too much sand in the data. Trends become less meaningful and predictive modeling won’t work. It is important to keep the level of granularity where you can make the best use of the data.
How have we handled this in the past? Enter “Uniques Exceeded.”
Because of the negative impact to reporting performance, historically in V14 and previous versions of Site Catalyst we have limited the number of reportable line items that can show up in reports during a given month. The historical algorithm works this way:
At the beginning of the month, all incoming values (big-traffic, medium-traffic, and low-traffic values) flow into reports:

Later in the month when the cardinality of the report reaches a pre-determined threshold (500,000 items by default), all new incoming values (regardless of popularity) are funneled into a single bucket called “Uniques Exceeded” :

This Uniques Exceeded algorithm achieves the goal of keeping reporting speed reasonable but has the nasty side-effect that important “big rocks” in your data that happen to come along late in the month are buried in the Uniques Exceeded bucket. You can’t see them as individual line items in your reports, at least as far as SiteCatalyst and Discover are concerned. Boo! Fortunately Data Warehouse (with a few exceptions) stores all the unique values so you can find the late-in-the-month big rocks that way, but Data Warehouse reports take much longer to generate than do reports in SiteCatalyst or Discover.
What can be done?
Sometimes the best way to rid yourself of unnecessary cardinality is to improve your implementation. From time to time you should take a look at the values you are capturing in high cardinality reports and ask yourself the question, “What actions do I want to take with this data? What questions do I need to answer? What level of granularity or cardinality will best help me achieve these goals?” VISTA rules can help you clean up data before it is sent in for reporting. For example, you could use VISTA to strip query string parameters from a URL.
For the remainder of this post though I will focus on the product enhancements we have just introduced that improve the usability of high cardinality data.
How does the new “high uniques” algorithm work?
****The new high uniques algorithm (which applies to both V14 and V15) works as follows:
At the beginning of the month, all incoming values (big-traffic, medium-traffic, and low-traffic) flow into reports:

Later in the month when the cardinality of the report reaches a pre-determined low threshold, all _low-traffic _values are funneled into a single bucket:

As the month progresses, if the cardinality of the report reaches a higher threshold, we begin funneling some medium-traffic values into the bucket.

If you think about this in the context of the chart at the beginning of this post you’ll see the net result is that much of the sand will be grouped together. You likely will never reach the high threshold. But most importantly, the “big rocks” in your data (the left-hand side of the graph) will always show up in your reports as individual line items, regardless of when they occur in the month!
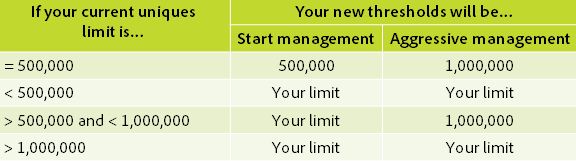
The thresholds mentioned above will depend on your current uniques limit:
https://blog.adobe.com/media_880fd64b130cf99ce8a3c0e3d3b7881bdf433b31.gif
From a technical perspective the algorithm is based on the number of times a value for a particular variable is passed in from your web site (i.e. the instances metric.) An example will illustrate how this works.
An example
Let’s say you are using a prop to capture a color, and at some time during a month the value “blue” is passed in:
- If “blue” is passed in early in the month before the report has 500 thousand line items, “blue” will show up in reports regardless of its traffic level.
- If “blue” is passed in after the report already has 500 thousand line items but “blue” has very low traffic each day for the rest of the month, “blue” will not show up as a line item in reports.
- If “blue” is passed in after the report already has 500 thousand line items, has low traffic for a few days, and then becomes wildly popular on the 20th of the month (for example), “blue” will start showing up in reports from that time forward. The total instances for “blue” will be slightly understated since it had low traffic for a while that was caught with the other sand, but starting on the 20th “blue” will show up as an individual line item in reports and will include the bulk of its traffic. It doesn’t really matter how much traffic “blue” gets for the remainder of the month. Once it has seen significant traffic it will show up in reports for the remainder of the month.
Typically you will see that any value with a hundred or more instances will show up in reports, although this depends a bit on the distribution of instances per distinct variable value. Most importantly, high-traffic values will always come through to reports regardless of when they occur in the month.
Is this the death of Uniques Exceeded?
Will the term “Uniques Exceeded” still show up in your reports? The answer, in the short term, is yes. But using the new high uniques algorithm it will be far less likely in most cases that Uniques Exceeded will show up in the top items in your report for date ranges after April 26. Given that data prior to April 26 used the old algorithm we decided to leave “Uniques Exceeded” as the name of the overflow bucket for now. Eventually we will rename this line item to “(Low-traffic)”.
Note that the counters start over at the beginning of each month, so most of you will start to see the net impact of the new algorithm throughout the month of May.
Case-insensitive traffic variables
Beyond the new “high uniques” algorithm, on April 26th we introduced the concept of case-insensitivity for traffic variables for all new report suites. That is, case will be ignored. This impacts the following reports:
- all props, page name, channel, server, custom links, download links, exit links
Using the example cited earlier, if the values “Home”, “home”, “HOME”, and “HomE” are passed into a prop they will show up as one line item in reports (usually the first version that was passed in during the month.) The metrics for all four versions will be aggregated together. Data Warehouse will use the all-lowercase version (“home”). The post column in data feeds will also use the all-lowercase version.
Later in the year we plan to add the option to enable case-insensitivity to existing traffic variables in existing report suites.
Conclusion
I hope you have found the contents of this post helpful. The new features I have described will greatly improve the value of reports with high cardinality. You will no longer need to worry about high-traffic values that don’t happen until late in the month!
I’d love to hear your feedback. Please feel free to post your comments below.
Postscript
I neglected to mention a nuance that certain “Traffic Sources” reports in SiteCatalyst V14 are limited to 25,000 unique items per day when the report is run with traffic metrics. This applies to the following reports: Domains, Search Keywords (including Paid & Natural), the Search Keywords by URL breakdown, Referring Domain, Referrer Type, and Referrers. The new “high uniques” algorithm does not impact this SiteCatalyst 14 limitation. SiteCatalyst 15 does not have this limitation.