Test&Target Updates to the Digital Pulse Debugger
SiteCatalyst customers have been using the DigitalPulse Debugger and its earlier incarnations to troubleshoot implementations for years. Test&Target customers, on the other hand, have relied on an assortment of various bookmarklets and hard-to-remember URL parameters. I’m glad to say that over the last year numerous improvements have been made to help you see the clockwork behind Test&Target. All you need is the DigitalPulse Debugger!
If you have the Debugger installed, you already have all of the latest enhancements. If you don’t, go to the following URL and drag the “DigitalPulse Debugger” link to your browser’s Toolbar or Bookmarks folder:
http://dwright.host.adobe.com/bookmarklets.html
Now that you have the bookmarklet, go to any page on your site with an mbox and click on the bookmarklet to open the Debugger.
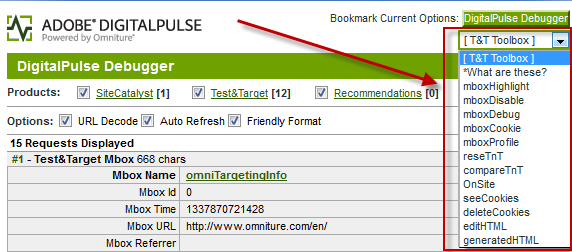
The most basic and powerful change was simply to roll up all of the obscure query string parameters and other tools into one place. In the upper-right hand corner you will see a dropdown menu called “T&T Toolbox” with many of your old favorites like mboxDisable, mboxDebug, mboxCookie, and mboxProfile:
https://blog.adobe.com/media_738ee21d628a505d27f12fdcd23fb628899974e8.gif
The very first option, “*What are these?” explains all of the other options. I highly suggest reading through this. Here are the tools that I use the most frequently when debugging issues for my clients:
-
-
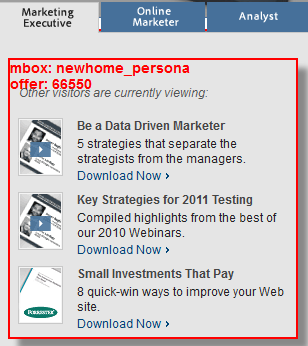
- mboxHighlight—I use this all the time to see where mboxes are on the page. There is also some advanced functionality that will show you the campaign name, experience name, and offer name associated with the mbox response. I will show you how to enable this advanced feature in my next article. For most customers, it will show the mbox name and offer id like this:https://blog.adobe.com/media_085588191c39c2edb9d2584fd8092f001f2c89c2.gif
- mboxProfile—this launches a popup to expose all of the rich profile data that has been collected against you as a visitor. All of your profile parameters and script profiles. If you are not able to enter a campaign or segment that is based off a profile, your first step should be to confirm that you have the correct value set in mboxProfile. Hint #1: The output is just raw XML and can be very long. We hope to improve this in the future, but until then use Ctrl-F to jump to the profile name you are interested in:https://blog.adobe.com/media_ffe4508c8c3cc152cea9e4611deabda3a1a5d2a3.gif
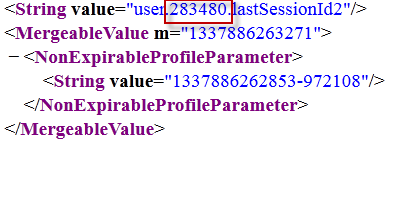
- Hint #2: If you use setLocal()/getLocal() when writing profile scripts, these values will also appear in the mboxProfile popup. You can identify these local variables by the number that appears between “user.” and the variable name. Here is an example:https://blog.adobe.com/media_d4211ee10b89cd3b2581232dd40d2321e8107542.gif
- deleteCookies—there are a million different ways to delete cookies, but since I often have the Debugger open, I just do it here. Not only will it delete all of the first-party cookies on the domain, it also reloads the page, allowing you to enter another experience. (Note: if you use a 3rd-party or 1st- and 3rd-party cookie implementation, the deleteCookies option will not delete the cookies needed to reset you as a visitor.
-
Those are the three main Tools that I use, but there are many more useful features. Please explore!
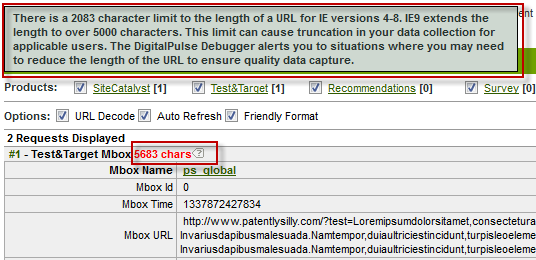
Many customers are unaware, but earlier versions of IE limit URLs to a length of 2083 characters. When server calls from visitors on these browsers crosses that threshold some of the data you are intending to pass to the Adobe servers gets clipped. This doesn’t happen often but tends to be more prevalent when customers use incredibly long URLs or pass up too many parameters. To call attention to these lengthy URLs in the Debugger, we now automatically highlight them red and add a little bit of explanatory text:
- https://blog.adobe.com/media_9b3e08fd67d0740013f564d743e5261321217fbf.gif
- Too many characters warning in the Adobe DigitalPulse Debugger
I hope you enjoy the recent improvements to the DigitalPulse Debugger!
(Note: After a recent update of Chrome, the Debugger ceased working on secure pages in Chrome. We are aware of the issue and will update this post when it has been resolved).