Discover 3.0 Fundamentals: Visitor-Level Fallout Analysis
https://blog.adobe.com/media_c30416273c6743354fa37bda81f75bb2c2292a99.gif
Over the coming weeks, the retail industry experts in Adobe Consulting will share a series of analysis quick wins for retailers, using Adobe Discover 3. For a limited time, Adobe SiteCatalyst 15 clients can inquire with their account team and ask to take part in a free trial of Adobe Discover. We’ve made it easier than ever to try Discover, and we’re showing some great Discover analysis opportunities specific to the retail industry. For more information and to request trial access, contact your account manager or account executive.
Adobe Discover — Retail Quick Win #4 Visitor-Level Fallout Analysis
One of the most exciting features for retailers, in my opinion, with the release of Discover 3 is the addition of a ‘Visitor’ view to several reports and metrics. We’ll take a look at some of the power made available by Discover 3 for unique data analysis you can do, especially if you are new to Discover or new to Discover 3. Let’s look at a few specifics in how to apply some of these exciting new features of Discover 3.
Perform Fallout Analysis for Sequences of Actions Across Visits
With the addition of segmentation in SiteCatalyst 15, we apply segments to your fallout reports, making it possible to identify the fallout paths for users who come to your site from a given marketing channel. Discover 3 takes this to the next level to allow you to incorporate any number of dimension and events directly into the fall-out and look at that across visits. Let’s look at an example.
We want to better understand, at a high level, the flow of our users who sign-up for an email, come back to the site from an email, add something to cart and eventually purchase. By nature, our question is going to span visits and a traditional SiteCatalyst or pre-D3 fall-out report won’t cut it.
“But can’t we get there with a visitor segment?” we might ask? While we could create a visitor segment which defined visitors who signed up for an email, came to the site from email, added a product to cart and then purchased, the important element missing from the segment solution is sequence. While your segment would include the group we’re looking for, it could also include individuals who purchased or added to cart before signing up for an email.
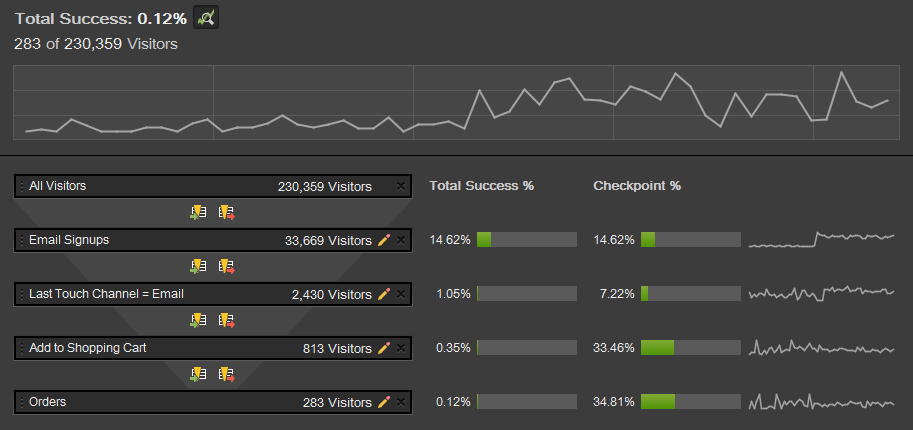
To build our fall-out report we simply drag over the events or dimensions (eVars or props) we want to include. We can then configure the dimensions for specific values, such as ‘Email’. An example of what our fallout report could look like is shown in Fallout Diagram 1.1:
Fallout Diagram 1.1: Email Signup Fallout Summary Report
https://blog.adobe.com/media_128a3cf1fcf1617fdc4764326ef32b0f7d8bc2f3.gif
The beauty of the flexibility here is we’re not limited to just pages or just events; we can mix and match any combination of interactions to build very specific analysis use cases, either at the visit or visitor level.
We can also group values of dimensions into the fallout step. For example, if I wanted to understand orders for visitors who had come from either Display or Social Networks, I could group them into a single fallout checkpoint, as shown in Fallout Diagram 1.2 and 1.3.
Fallout Diagram 1.2: Display OR Social Networks Last Touch Channel – Fallout Checkpoint Builder
https://blog.adobe.com/media_17a484e69b1c973d4891559d0862bc31b796f774.gif
Fallout Diagram 1.3: Display OR Social Networks Last Touch Channel Fallout Summary Report
https://blog.adobe.com/media_36cc5f64ce1a988912c1e0594855d4ea4b753019.gif
Perform Fallout Analysis for Sequences of Marketing Channel Interactions Across Visits
****Let’s dig in further and investigate the fallout between certain channels. We’ll start by looking at all visits for all visitors who came in from paid search, but exclude those visits where the final touch before conversion was Paid Search. We want to remove some of the noise from those visits where someone came in and converted from Paid Search. An example of this segment is shown in Fallout Diagram 2.1. This allows us to zero in on those visitors who came to the site from paid search, but didn’t convert on that visit.
Fallout Diagram 2.1: Paid Search Visitors Segment
https://blog.adobe.com/media_e6d4a392070e6c0583bcc00ec37c6eeed430d3dc.gif
We then apply this segment to our channels report to understand what channels users eventually ordered from when they had also visited from paid search. This gives us the initial information we want to be able to compare the relationship of our other channels to paid search to get a sense of which we’d like to dig further into.
Fallout Diagram 2.2: Last Touch Channel Report with Paid Search Visitors Segment Applied
https://blog.adobe.com/media_1a647cd3b9de9cff49190d626bb004c0b0abff0a.gif
We notice from our example that Display and Comparison Shopping have the highest number of visits and orders, so let’s dig in further to each of these channels.
We can incorporate each of these channels into their own fallout report and then compare how they perform against each other. In so doing, we’re able to see which one performs better with visitors who had previously clicked through on a paid search ad and begin to understand the relationship between paid search and these two other channels.
To ensure we are working with mutually exclusive populations (to help remove any noise we might experience from users who used both Display and Comparison Shopping) we’ll create a simple exclude visitor segment for each fallout report. An example of the segment for excluding Comparison Shopping from the Display Ad fallout report is showing in Fallout Diagram 2.3.
Fallout Diagram 2.3: Visitor Exclude Comparison Shopping Engine Segment
https://blog.adobe.com/media_22516bd3fb79d4e262b4dd6a7eefb2513e9009a8.gif
After applying each segment to a unique report, we then build our fallout reports and make sure we have the ‘visitor’ option selected. I like to include all visitors to get a sense of how the populations compare to each other. Additionally, we can also specify on the last channel, that this channel was the channel where the order took place. We do that by selecting the ‘Order’ event from the Checkpoint Editor as shown in Fallout Diagram 2.4.
Fallout Diagram 2.4: Display with Orders Event Fallout Checkpoint Builder
https://blog.adobe.com/media_f722fd95cac898e41f28d98167e247a6502c8eeb.gif
As we now examine our fallouts, we’re able to make some interesting observations.
Fallout Diagram 2.5: Paid Search Fallout with Last Touch Display Summary Report
https://blog.adobe.com/media_9d04e71dbf2de43d77f0043ef0effbc3a09eb9ca.gif
Fallout Diagram 2.6: Paid Search Fallout with Last Touch Comparison Shopping Engines Summary Report
https://blog.adobe.com/media_5846a3510ca8d7c7caeb0a727c6f40dde39682e7.gif
First, we notice that the population we’re dealing with for Comparison Shopping is about ¾ of the population of Display. Immediately we start to understand browsing behavior for visitors who have come through from Paid Search may be less likely to come back and convert from Comparison Shopping than Display. This could be impacted by the overall marketing strategy or associated messaging of each distinct channel. Additionally, we observe that users coming back from Display convert more than three times as high Comparison Shopping. Again, we may want to examine what our overall strategy or messaging is in relation to Comparison Shopping. Armed with this information about the relationship between Paid Search and Display, we could adjust our messaging for Display.
Final Thoughts
****For retailers, fallout analysis in SiteCatalyst has been one of the ‘Go To’ analyses for finding hidden monetizeable opportunities. With the addition of segmentation in SiteCatalyst 15, analysts have been given more flexibility to quickly answer questions about how users interact with aspects of their site during a visit. Now, with Discover 3, retailers can expand their questions to include interactions occurring across multiple visits, answering questions they couldn’t before. If you haven’t dug into this exciting feature, I’d encourage you to carve out some time over the next week to try it out.
https://blog.adobe.com/media_32f6b6a3605b47d21d42522ff1ece5f4cbb8b8e4.gifDerek Tangren is a Principal Consultant and Team Lead in Adobe Consulting, focused on digital strategy, analytics & optimization for retail & travel clients. He tweets at @derektangren.
If you’re an online or cross-channel retailer using Adobe SiteCatalyst 15, you should try these Retail Quick Wins in Adobe Discover. We’ve made it easier than ever to experience a free trial of Discover. For more information and to request trial access, contact your account manager or account executive.