Discover 3.1 – Media Quick Wins: Content Velocity
https://blog.adobe.com/media_5a0d065678a2bbc3988d65226fa97f03d9ce31bb.gif
Over the coming weeks, the media industry experts in Adobe Consulting will share a series of analysis quick wins for media publishers, using Adobe Discover 3. For a limited time, Adobe SiteCatalyst 15 clients can inquire with their account team and ask to take part in a free trial of Adobe Discover. We’ve made it easier than ever to try Discover, and we’re showing some great Discover analysis opportunities specific to the retail industry. For more information and to request trial access, contact your account manager or account executive.
Adobe Discover — Media Quick Win #1 Content Velocity

http://blogs.adobe.com/digitalmarketing/wp-content/uploads/2012/10/rocketLaunch1.jpg
Discover is a powerful segmentation tool that allows instantaneous complex filtering and analysis. If you like the segmentation capabilities of SiteCatalyst 15, you will love the added strength that Discover brings to the table when looking for the answers to very specific business questions.
As a consultant primarily focused in the Media Industry, my favorite aspect of Discover is the ability to create multiple layered segments on the fly and answer specific questions without having to wait for Data Warehouse, or for an implementation change to take effect. Another killer aspect of Discover is the ability to measure Content Velocity.****
****What is Content Velocity and why is it cool?
Like a rocket ship launching into space that accelerates as it lifts off the platform, Content Velocity allows you to see which of your content is best at accelerating user engagement – in other words, which content drives additional page views / content consumption.
How does it work?
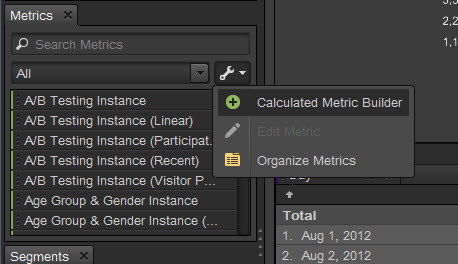
****In Discover, we start by creating a calculated metric. The easiest way to do that is to go the Metrics Pane, then click on the wrench, and select the Calculated Metrics Builder.
https://blog.adobe.com/media_a7cd62f425833fabbe2d645e5ee772147be30b98.gif
Once in the Calculated Metrics Builder, go to your Conversion (Participation) metrics list, and look for your Page View (Participation) metric. (In this case we have named our Page View Event as “Page Count”). Pull that in, and then divide that by your Visits metric.
(Sidebar note: To enable Participation on events in SiteCatalyst requires the involvement of Client Care or Adobe Consulting. It is processing heavy and contractually there are limitations as well as potential latency issues. Another key benefit with Discover is that you don’t have to involve Client Care or Adobe Consulting to enable Participation on your Page View event. In Discover, participation is already built in on all events! No contractual limitations, no calls to Client Care or Consulting, and no latency issues! Win! – ( Note within a note: if you do not have a Page View event, you can set one up via a SiteCatalyst processing rule))

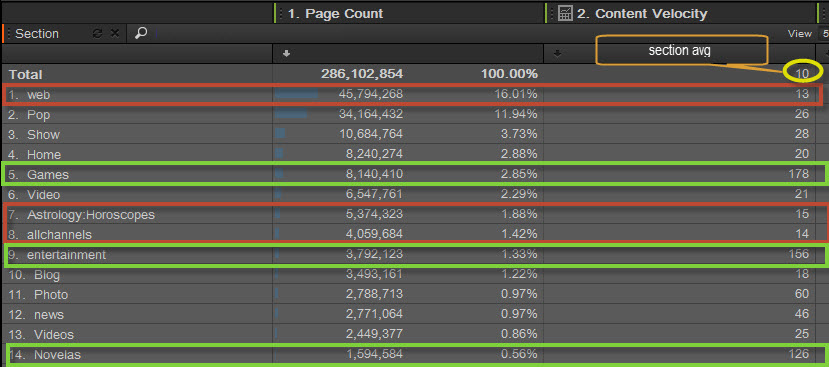
This will allow us to see the “participation” of different content in terms of page views. In other words, if a user saw Section XZY or Article ABC, how many additional page views did they see in that visit. This type of information helps content editors understand what types of content are performing or underperforming and make decisions. So let’s take a look.
https://blog.adobe.com/media_f387c56486bc2c643a19119bb8ccd25b26a54377.gif
Here, we can see that those who came to the Games section (in one of the green boxes above), saw 178 total pages per visit on average, which is 1680% higher than the overall section dimensions’ average pages seen. We can also see a few other hyper-performing sections: “entertainment” and “Novelas”. With this analysis in hand, we can now dive deeper and look at what specific content are driving this exceptional performance. For example, breakdown the Games section by the content title variable to see the specific content that was driving that section’s great performance. We can also see a few sections that are not performing so well (relative to our hyper-performers), in the red boxes. Likewise, we can dig further into these by breaking them down by other dimensions. Or if we want to find our worst performers, we can click on the down arrow to sort low to high.
Adding Segments to Calculated Metrics
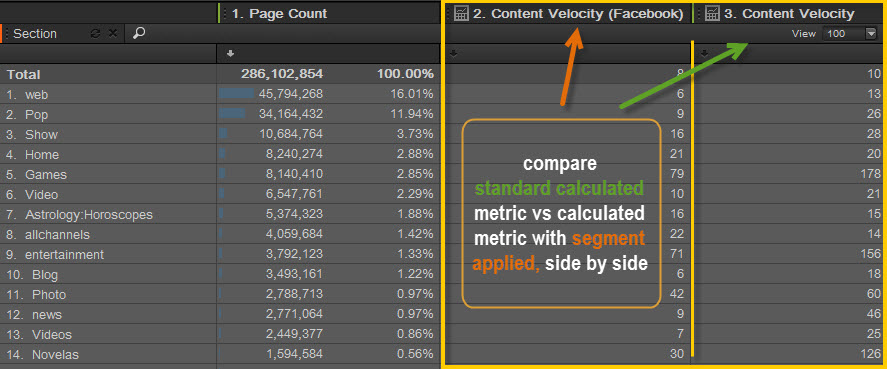
Changing gears slightly, now let’s say that we are interested in analyzing Content Velocity in terms of a specific segment. A new feature just released in Discover last week allows us to add segments to our calculated metrics.

This is pure awesomeness. Once set up, we can quickly compare Content Velocity for our Report Suite vs. a particular segment (in this case Content Velocity for Facebook Visits), all at a glance. Behold below example of this in action.
https://blog.adobe.com/media_ad7d61a95cf7e103cae17c231bc40b61765e6996.gif
This new ability to add segments to your calculated metrics, brings additional flexibility, efficiency and depth to your analysis. Rather than spending your time pulling various reports and comparing them using excel or some other tool, you can spend your time doing beneficial analysis.
Wrapping Up
The Content Velocity calculated metric is a powerful way to understand which content is driving more engagement on your site. By adding segments to your Content Velocity calculated metric (and others) to gain deeper insight into specific user groups.

http://blogs.adobe.com/digitalmarketing/wp-content/uploads/2012/10/discover3trialthumb.png
If you’re a media publisher using Adobe SiteCatalyst 15, you should try these Media Quick Wins in Adobe Discover. We’ve made it easier than ever to experience a free trial of Discover. For more information and to request trial access, contact your account manager or account executive.