Discover 3 Fundamentals: Price Point Analysis
https://blog.adobe.com/media_c30416273c6743354fa37bda81f75bb2c2292a99.gif
The retail industry experts in Adobe Consulting continue to share a series of analysis quick wins for retailers, using Adobe Discover 3. For a limited time, Adobe SiteCatalyst 15 clients can inquire with their account team and ask to take part in a free trial of Adobe Discover. We’ve made it easier than ever to try Discover, and we’re showing some great Discover analysis opportunities specific to the retail industry. For more information and to request trial access, contact your account manager or account executive.
Adobe Discover – Retail Quick Win #7 Price Point Analysis
Price point analysis reviews differing total purchase sale amounts that occur on site. Discover provides an efficient tool to run data slices of converted order visit characteristics. Discover users can utilize this data to highlight site experiences that impact visitor intent and conversion behavior. In the below examples we will cover two applications of price point analysis and additional data dimension opportunities.
Discover enables price point analysis through flexible segment builds and the exploratory nature of Table Builder. We might undertake a price-point analysis to answer questions such as: Which set of different price point ranges is garnering the largest share of revenue? What product dimensions are most popular with distinct price point revenue ranges? Which site content or site paths are most common for a given set of customers purchasing above or below a specific price-point range? Are there price point revenue total sales differences as a result of marketing channels or promotional offers?
Price point analysis is yet another way that Discover can pull apart high level site trends and dive into the specific traits of valuable customer segments.
Price Point Analysis Example 1: Customer Price Point Review
CRITICAL UPDATE: 7-19-13
- Starting with the 7-19-13 maintenance release, ad hoc analysis (Discover) will be changing currency formats in custom events that will affect reports and segments in some cases. For example, ad hoc analysis uses a penny (.01) as the baseline value, but starting next month, all currency will be based on the dollar (1.00). This is the same for all currencies.
In most cases, reports and segments previously built will remain unchanged. Most existing reports and segments in the new format will see no changes in values or functionality. The data values in the report will not change but the values in the segment rules will change for currency operations. For example, if you created a custom event that runs in segment with a 50 cent value, then it will be changed to a .50 dollar value and return the same values as it did previously.
When converting formats is not possible, an error will display in the Segment Builder stating that the variable is obsolete. See the KB article for additional information about rebuilding your segments if needed.
Question: What is the spend share across product departments for purchases by different total revenue price point segments? How are product departments sales linked with distinct price point segments?
Potential Action: Identify common product price point groupings to inform site merchandising and categories presentation. Review the influence of marketing campaigns and promotions on product purchasing patterns by product dimensions.
Analysis approach:
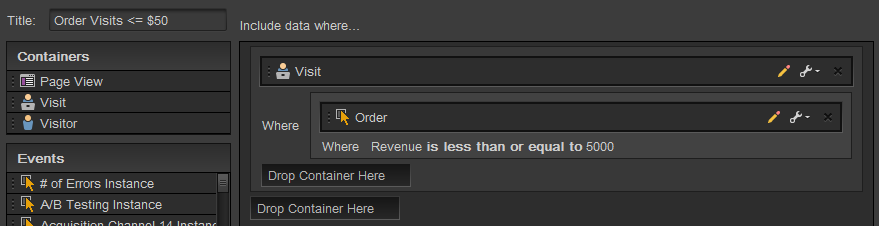
– Identify/segment order visits using specific revenue amount tiers. For example in our first segment we built a Visit container that includes sessions with an Order where the ‘Revenue is less than or equal to 5000’ ($50.00).
Diagram 1.1: Visits with an Order where the Revenue is less than or equal to $50.00
https://blog.adobe.com/media_577f52a053de04b26ce6630968d7142c4c3d5bdf.gif
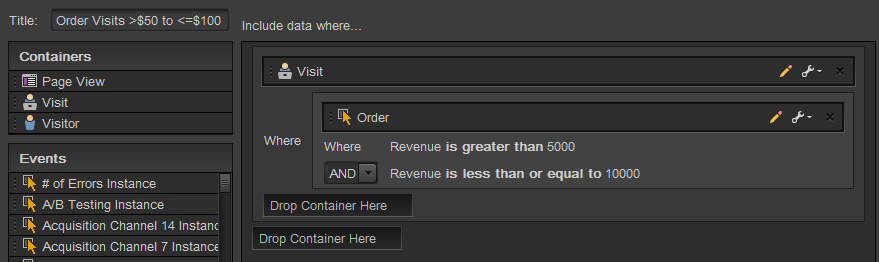
Diagram 1.2: Visits with an Order where the Revenue is greater than $50.00 and less than or equal to $100.00
https://blog.adobe.com/media_2ed3ddf4ddbfb5c5226db0ec8ff9ae52702482a3.gif
Diagram 1.3: Visits with an Order where the Revenue is greater than $100.00 and less than or equal to $200.00
https://blog.adobe.com/media_17860675cc78e3adec54443845567f564d97ae34.gif
– The next step is to run the desired products dimension reports. Observe the differences in the context of Products, Department, Category, Vendor, or Line.
– As shown in Diagram 1.4 below we observe the revenue spread across the Product Departments and note the concentration of the two lower price-point tier segments (Visits with an Order where the Revenue is less than or equal to $50.00, Visits with an Order where the Revenue is greater than $50.00 and less than or equal to $100.00) is in ‘Beauty & Fragrance’ and ‘Children & Toys’. The higher sales price point segment is garnering additional revenue through increased product department diversification and higher ‘Womens’ traffic and purchases. This may be an opportunity to expand the internal campaign footprint of higher sales achieving product departments, bolster cross-promotion efforts, and examine ways to up-sell the two lower price-point mainstay departments.
– As show in in Diagram 1.5 we observe a similar acquisition marketing trend across the three different price point tier segments. The highest price point segment has the best traffic spread across acquisition channels, but no one acquisition channel seems to be a differentiator across the various price points. A channel or campaigns report in the context of price point tiers is a great way to validate assumptions about the value various acquisitions efforts are bringing into the site.
Diagram 1.4: Price Point Segments by Product Department Visits, Orders, and AOS (Calculated Metric: Revenue/Orders)

http://blogs.adobe.com/digitalmarketing/wp-content/uploads/2012/10/PricePointEx4.png
Diagram 1.5: Price Point Segments by Acquisition Channel Visits, Orders, and AOS (Calculated Metric: Revenue/Orders)

http://blogs.adobe.com/digitalmarketing/wp-content/uploads/2012/10/PricePointEx52.png
Price Point Analysis Example 2: Customer Price Point Site Entry Areas
Question: What is the entry page or site section of purchases by different total revenue price point segments? What is the entry Department, Category, or Subcategory site content section by different total revenue price point segments?
Potential Action: Identify the areas of the site that are drawing specific converting segments by price point tier and tailor the site to their historical preferences or conversion characteristics. Reaffirm marketing offers and use internal marketing to shift visitors to higher price point tiers through user indicated product affinities.
Analysis approach:
– Identify/segment order visits using specific revenue amount tiers. As mentioned before the total revenue amount in the Discover rule build must be entered as a whole number and multiplied by 100 without decimal points.
– Run an entry pages, section, or any custom traffic entries report as the main dimension element.
– Evaluate traffic trends against the different segments and over time in the context of specific marketing, internal campaign efforts, and product merchandise seasonal periods.
– As shown in Diagram 1.6 and 1.7, the high importance of the home page on converting visits is a major element in all three price point tier segments. Social site content elements along with specific high traffic product department site sections also surface in the reports. An opportunity to engage testing or drive further traffic to these site content areas could result from these insights.
Diagram 1.6: Price Point Segments by Entry Page Visits, Orders, and Revenue

http://blogs.adobe.com/digitalmarketing/wp-content/uploads/2012/10/PricePointEx6.png
Diagram 1.7: Price Point Segments by Site Content Entry Subcategory Visits, Orders, and Revenue

http://blogs.adobe.com/digitalmarketing/wp-content/uploads/2012/10/PricePointEx7.png
Tips & Tricks
- As my colleague David Yoakum mentioned in his Basket Analysis blog post (http://blogs.adobe.com/digitalmarketing/analytics/discover-3-0-fundamentals-basket-analysis/), it is a key skill to be comfortable exporting data out of Discover into Excel. Often times you can copy down a series of similar data outputs and then perform Excel formula subtraction calculations to determine overlap across segments and derive even narrower data slices.
- A retailer may want to enhance their reporting with product view price or cart add price into separate custom events as this will allow for pre-purchase price segmentation views. It also allows for an analysis into captured revenue starting from initial visitor product interest points.
- Leverage an order confirmation # custom conversion variable to verify segment definitions are accurate on a per transaction level quickly using the low/high value sort arrow function.
- If your site customers have a high propensity for multiple purchases over the same visit, this will create crossover among your price point segment tiers on a per visits basis. Be sure to account for or exclude multiple orders within the same visit from segments in the end data reports.
Conclusion
As the prior examples illustrate, there are numerous price point analysis applications possible in Discover. The power of Discover rests in the ability to create and iterate on these price point builds in conjunction with any other segment characteristic a user requires to analyze a business scenario. Discover shows how a nuanced view of site visitor conversion behavior can be gained through investigative efforts from a straight comparison standpoint all the way up to a detailed trend view. I would encourage all Discover users to take a long review of all conversion characteristics that stand out to inform strategic planning and guide optimization efforts.
https://blog.adobe.com/media_32f6b6a3605b47d21d42522ff1ece5f4cbb8b8e4.gifBrian Au is a consultant in Adobe Consulting, focused on digital strategy, analytics & optimization for retail & travel clients. He tweets at @brianau.
If you’re an online or cross-channel retailer using Adobe SiteCatalyst 15, you should try these Retail Quick Wins in Adobe Discover. We’ve made it easier than ever to experience a free trial of Discover. For more information and to request trial access, contact your account manager or account executive.