Hey World – Have You Met ReportBuilder?
In today’s blog post I wanted to discuss reporting and highlight a few of the features in our ReportBuilder Tool. While many of our readers are ReportBuilder experts I still get frequent questions on the topic so I figured it was worth covering a few of the features I find most valuable.
ReportBuilder is used to pull SiteCatalyst data into excel so that it can be further analyzed, manipulated, and reported on. Often ReportBuilder is thought of as just a dashboarding tool. However, I rarely perform analysis for clients in SiteCatalyst, but rather pull the data into excel so I can better analyze and apply statistical models to the data. If you’re not using ReportBuilder in your daily job, it may be time to start.
Quick Intro to ReportBuilder
I’m not going to give a step by step of how to use every feature in ReportBuilder so here is my over-simplified version of how ReportBuilder works:
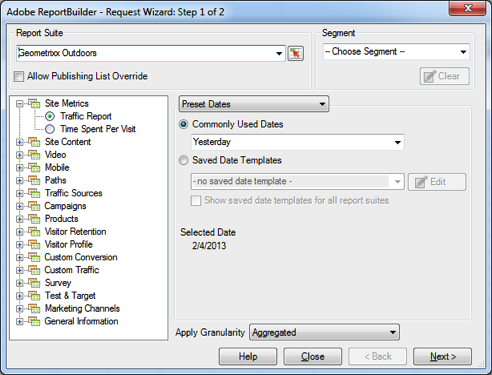
https://blog.adobe.com/media_0b7ece187bbbd0eb600cc07409a038eb160be958.gifStep one: Choose your report suite, select the base report you are pulling, choose a date range, and decide what granularity you want.
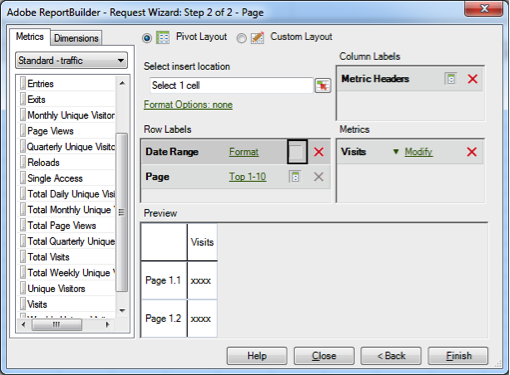
https://blog.adobe.com/media_cf2f2a72d4ba5598e511fa4f4121b17af82f948e.gifStep two: Select metrics, choose additional dimensions (breakdowns), organize pivot table structures, and insert the data request.
Let’s Dive Deeper
Now that we’ve covered the basics let’s talk about some of the lesser known and more advanced features of ReportBuilder that will help in your analysis and reporting. Although there are many cool things that you can do with ReportBuilder, I’ve chosen three.
Cool thing #1: Multilevel breakdowns are available on classifications.
In SiteCatalyst when breaking down an eVar or eVar classification you are limited to a two-level breakdown.
Imagine you’re the Display marketing guru at your company and are running multiple display campaigns across multiple placements. If you need to pull a report that shows Marketing Channel (display) broken down by Ad Name (skiing specials) and then broken down by Ad Placement, you won’t be able to do this in SiteCatalyst.
SiteCatalyst only provides one level breakdowns on eVars and classifications.
https://blog.adobe.com/media_63c158da4dad8a2fc6925ba520a520b61e402ae4.gif
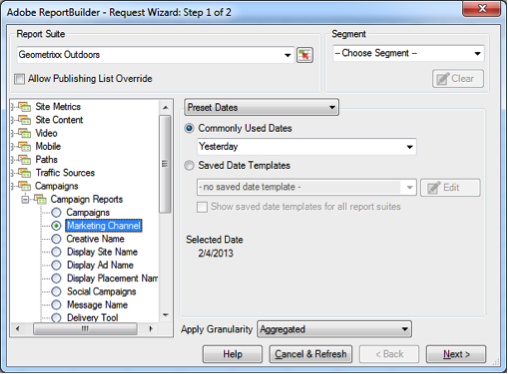
ReportBuilder, however, allows you to pull multiple level breakdowns on classifications. To do this I first chose campaign> Marketing Channel in step one of the wizard.
https://blog.adobe.com/media_3c4ea8e5dd646b1f886969d8612505d837750163.gif
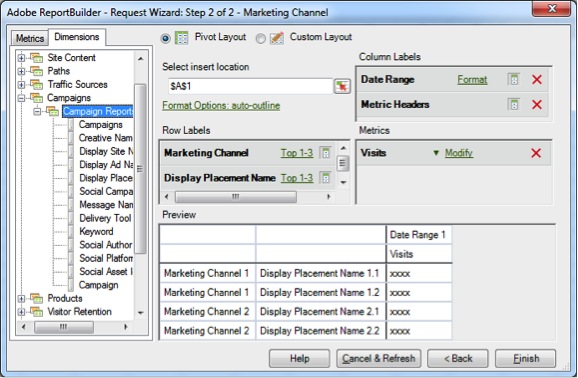
In step two of the wizard I clicked the Dimensions tab and dragged over Display Ad Name and Display Placement (these are classification columns).
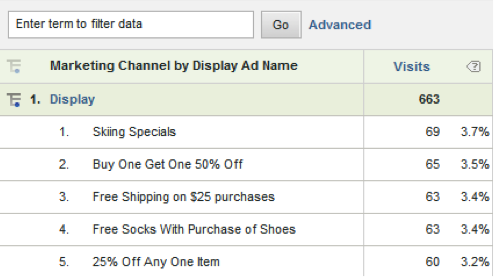
https://blog.adobe.com/media_a4a41478f5e1873e115b81ba040a9cd11204e7ca.gifThe end result is a report with multiple breakdowns.
https://blog.adobe.com/media_9ba2eab4fc22b5276155c1ba8520f6ce3e22577a.gif
Cool thing #2: Matching
In ReportBuilder you can pull a data set (example: top 15 articles) for a specific time period then return results for that same data set for a different date range.
This is useful if you want to build a “Movers and Shakers” report. A “Movers and Shakers” report just shows which keywords, articles, etc… had the biggest increase or decrease in traffic over a given time period.
https://blog.adobe.com/media_d44c9cdae1a7c4e1c4e9b324b6d4c5b261c21c41.gifFor this example let’s say I used ReportBuilder to pull the top 10 internal search keywords for last week.
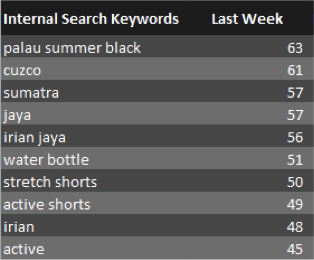
https://blog.adobe.com/media_44c4b1ab36112fea51a10a476e183b292001d8e3.gifNext highlight the 10 keywords, right click on the highlighted results, and select Add Dependent Request > Matching.
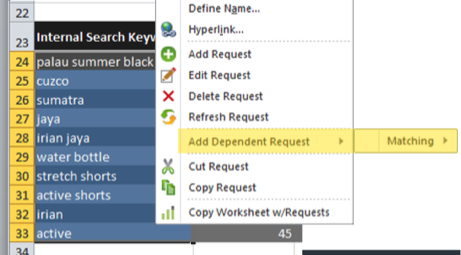
https://blog.adobe.com/media_1ad53e37b3b724ed55e521e7cb3a18835da011e5.gifThis will bring up the first step of the Request Wizard. Here you can change the date to be the previous week.
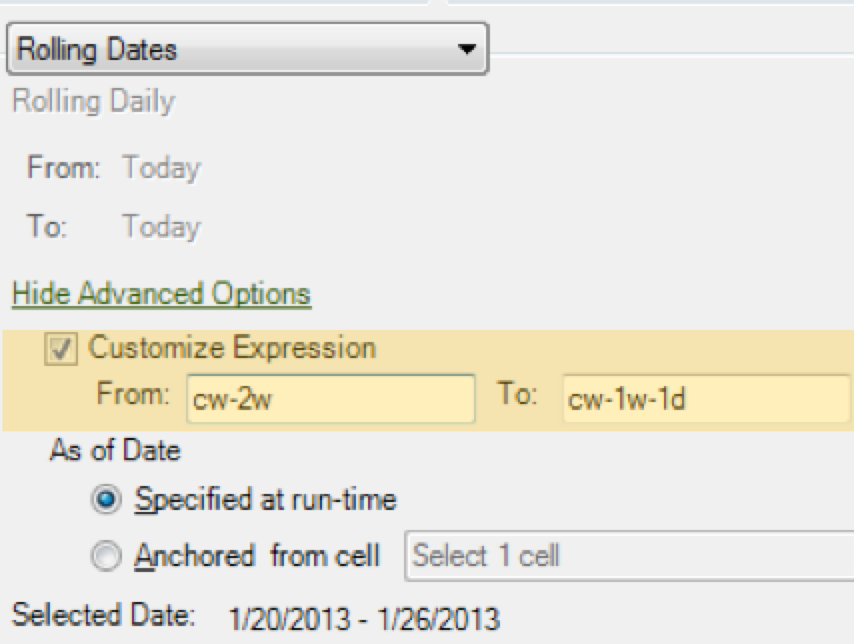
On step 2 you just need to select your metric and the insert location. The result will be a report similar to the one below. You can then apply different formulas to sort and rank by greatest percent change.
https://blog.adobe.com/media_6af885fa17e16dc1190d79da831c239b8681cda7.gif
**Cool thing #3: **Segmentation
Just like segmentation is available in SiteCatalyst 15, it is now available in the newest version of ReportBuilder. This is great for clients that want to report on their top KPIs for multiple segments. Imagine creating a KPI dashboard for each of your customer segments without needing to do correlations and subrelations. You can create one KPI dashboard and copy it for each segment.
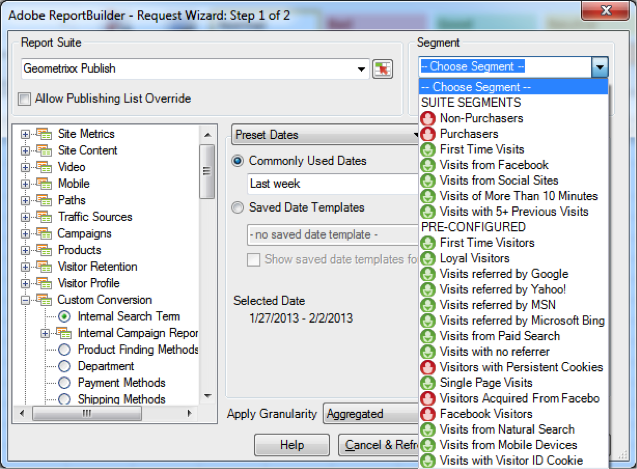
The process for adding a segment is straightforward. On step one of the Request Wizard you will find a dropdown for segments.
https://blog.adobe.com/media_2861defcbe3b9acd4cb57885e4027bf6c06ac95f.gif
These segments need to be created in SiteCatalyst first. If you are logged into ReportBuilder when the segment is created you will need logout and log back in before the segment will become available.
As a bonus tip (I know you wanted one more), if you create a segment in the SaintCatalyst interface it will be available to just you and for a specific report suite. If you create that segment in the SiteCatalyst Admin console it will be available to all users for a specific report suite. However, if you create the segment in Discover and put it in a shared folder it will be available to all users for all report suites.
Good luck with your analysis using this great tool from Adobe!