Using Net Promoter Score to help improve customer experience

Companies are continually looking for ways to improve the customer experience they provide and to put their customers at the heart of everything they do. A popular strategy to help achieve this is to listen to the Voice of the Customer, by asking for feedback on their experience.
However, to get the best results from a Voice of the Customer program, companies need to make sure they ask the right question, at the right time, in a way that is relevant to the context of the user interaction. They also need to ensure that they can apply the customer’s feedback to actually drive improvement in the customer experience — i.e. to make the customer feedback actionable.
For the last 12 months I have been working with one of the worlds leading telecoms companies on their voice of the customer strategy. The following article looks at the challenges we faced in this program, and how we addressed them.
Challenge 1: Asking the right question. We have all seen lengthy web surveys where there is always one more question to answer. However, go too far in the other direction, asking only very generic questions, and the response will lack focus.
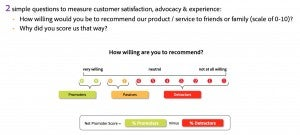
To ensure we only present short surveys that are not too much trouble for the customer to bother responding to, we made use of Net Promoter Score, a methodology that boils all the questions you may want to ask into 2 simple questions – a score and a free text response.
https://blogsimages.adobe.com/digitaleurope/files/2013/07/Screen-Shot-2013-07-24-at-14.06.43.jpg
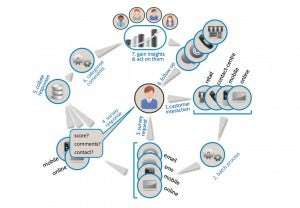
By combining the response to these questions with other information about the customer – what they were doing before and after survey, why they were sent the survey and other data such as CRM or sales information, we can associate their response with where they are in the user journey. This allows us to understand their response in the context of their most recent interaction with the company – the customer TouchPoint.
Challenge 2: How to collect feedback consistently across the customer journey. So different responses can be compared, we needed to standardize the way in which customer feedback to collected, processed and analyzed. By using the same survey questions (NPS questions) across all channel and all stages in the user journey, we can ensure results at different stages in the customer journey or on different channels can be compared.
This allows us to answer questions like which service channel delivers the highest level of customer satisfaction (web self service, call centre, social, face 2 face etc. )? Why do people prefer that channel? What about multi-channel experiences?
However, the method of collecting the customer responses also needs to be standardized to ensure they are comparable. In this case we used a combination of web and SMS based surveys, both asking NPS survey questions with exactly the same wording. By using near real time (within 30 minutes) triggers to initiate presentation of the survey, response rates were dramatically increased. By using automated survey triggers, volumes could be scaled far higher than traditional “clipboard” or call centre customer surveys.
**Challenge 3: Sorting, categorizing and attributing the drivers for positive and negative experiences. **Once we had the foundations in place – what we were going to ask and how we were going to ask it — we needed to look at how we would process the responses. Here, we worked closely with the Adobe Partner, Clarabridge.
By using Clarabridge’s Natural Language Processing (NLP) capability, we were able to process each survey response to:
- Quantify positive or negative sentiment
- Identify what contributed to positive or negative sentiment in the feedback (i.e. the free text or verbatim response to the “why” NPS question) — the NPS drivers
- Categorize that response according to the business unit or follow up action needed to address the driver or cause of that (negative) experience.
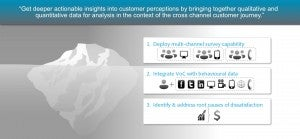
Challenge 4: Getting a complete picture. Through the combination of robust, scalable survey collection; automated processing and categorization of the responses using Clarabridge; and matching survey responses with other sources of customer data (e.g. web and mobile behavioural data from Adobe Analytics, social data from tools such as Adobe Social and other sources of data such as the CRM system, Point of Sale data and IVR/call centre records); we can provide a complete picture of the user’s segment, actions and feelings as they moved through the customer journey.
This data, that combines qualitative voice of the customer feedback with quantitative data about actions taken, allows us to visualize any trends in the customer experience, to quickly highlight any problems in real time, and apply business rules to the result to identify individual pieces of customer feedback that needed reply or follow up.
As the processing of the free text “why” responses in Clarabridge provides quantitative data as the output (sentiment, NPS drivers, business category) this data can easily be combined with other sources of data (the NPS score, customer journey stage, customer actions, demographic, geographic and contract data etc.) to give a complete data set for deeper analysis.
Together these sources of data provide both a macro view of the “big issues” or common trends, and a microscopic view of individual customer problems or challenges.
Challenge 5: Closing the loop with the customer. The final piece of the puzzle was how to use this Voice of the Customer feedback to actually improve the customer experience and to guide business change.
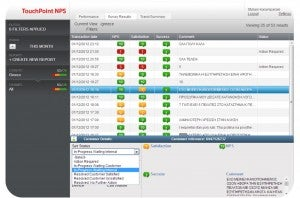
Using business rules that look for combinations of certain customer types, comments, driver categories and/or NPS scores, we can mark certain survey responses as needing follow up. The follow up action can then be managed using a light weight dashboard UI provided to NPS task forces, or the data about the feedback and required follow up action can be fed into a CRM or workflow tool.
https://blogsimages.adobe.com/digitaleurope/files/2013/07/Screen-Shot-2013-07-24-at-15.26.44.jpg
Closed Loop Net Promoter Score Management
The solution put in place for this customer to address these challenges, the TouchPoint Solution, consists of 3 functional parts:
- Multi-channel surveys (based on the Adobe Survey product) t
- The integration of behavioural data and voice of the customer data (using Adobe Analytics, Adobe Social and Clarabridge)
- A set of dashboards to identify and follow up on the causes of customer dissatisfaction (developed using Adobe Experience Manager).
https://blogsimages.adobe.com/digitaleurope/files/2013/07/Screen-Shot-2013-07-24-at-15.29.48.jpg
The following is an example of the closed loop dashboard:
https://blogsimages.adobe.com/digitaleurope/files/2013/07/Screen-Shot-2013-07-24-at-15.29.03.jpg
In summary the TouchPoint solution helps:
- Run multi-channel surveys and consistently measure NPS
- Reduce the cost of voice of customer survey collection
- Support customer journey optimisation initiatives such as call centre deflection and right channeling
- Measure and compare customer experience across multiple channels
- Scale voice of the customer programs so all customers can be surveyed as opposed to only a sample
- Use NPS as a metric in a compensation plan to encourage teams to focus on delivering high levels of customer satisfaction
- Integrate behavioural and voice of the customer data
- Build a complete picture of customer behaviour and sentiment (for analysis in Analytics Premium)
- Analysis of NPS feedback in the context of multi-channel data (CRM, ePoS, IVR, online, demographic etc.)
- Natural language analytics around NPS verbatim to rate sentiment and map feedback to follow up categories or root causes
- Categorisation and sentiment scoring of free text feedback also turns qualitative feedback into statistical data for statistical analysis
- Identify and follow up on the causes of customer dissatisfaction
- Workflow to “close the loop” with customers – allowing companies to follow up 1:1 with individual customers who give a low NPS score
- Dashboards to monitor NPS trends by channel and business hierarchy (dashboards are mapped to org structure, so execs see a macro view across channels, channel managers see data for their channel, team leads see detailed data per employee)
- Identify dissatisfied customers at risk of churn and manage follow up actions
- Identify the drivers behind positive and negative customer experiences
- Guide and focus investment on customer experience improvement
If you’re interested in developing a similar strategy for your company, please get in touch with me.