Leverage Analytics with Contribution Analysis Tips Tricks and Best Practices: Part 2

In the first part of this post, we saw that Contribution Analysis is a groundbreaking new “data-scientist-in-a-box” uber-lever, letting you start moving heaven and Earth for your boss. We also dipped into tips, tricks, and best practices for selecting the right variables and deselecting less-useful ones, so you can see clearly enough to place your lever properly and get your Contribution Analysis going.
More Contribution Analysis Tips, Tricks & Best Practices
In the previous installment, we covered variable selection. Now it’s time to hit hard on other crucial Contribution Analysis features.
Interactions & Actions
Within Contribution Analysis, you can curate data visualizations and perform a number of actions and interactions. You can use several new visualizations to filter your Contribution Analysis drilldown. You can hide individual items across Contribution Analysis for a more curated experience. You can also select items or use the Top Segments area to create and save segments directly from CA within the Segment Builder. You can favorite and bookmark a Contribution Analysis for sharing and rapid recall. Here are a few tips for maximizing the value of your interactions and actions:
- Hiding Items – remove uninteresting items by selecting them and clicking “Hide Selected” (for items you usually hide, consider permanently removing dimensions in the Configuration area)
- Filter Scatterplot – select items in the tree map and then toggle to the scatterplot
- Scatterplot – generally, the most interesting items are in the upper right-hand corner
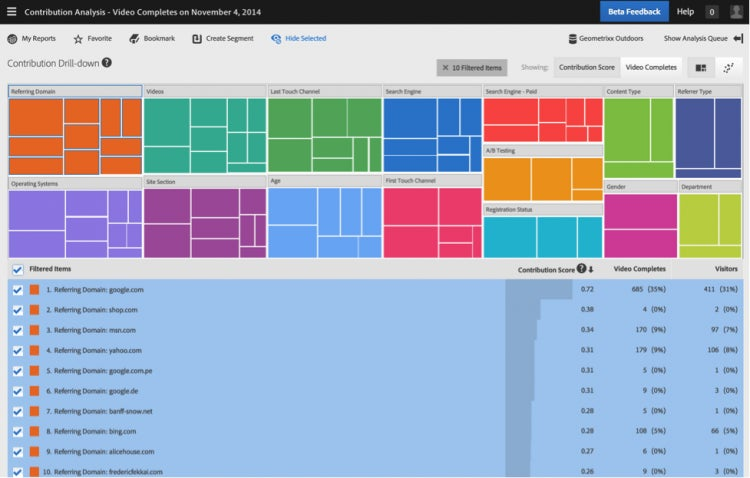
- Hide All Dimension Items – click the dimension name within the tree map, then select and hide all items for that dimension in the table below the multi-colored graphic (see Figure 4)
http://blogs.adobe.com/digitalmarketing/wp-content/uploads/2015/03/jb1.png
Figure 4. To maximize the strength of the insight, try hiding all items for a dimension that is less interesting or valuable.
Apply Segments
Any segments that you apply to Anomaly Detection are inherited by Contribution Analysis as a data filter before the analysis. To filter and refine Anomaly Detection, apply segments to your data.
Interpretation
Contribution Analysis ranks the impact of each data item analyzed in the form of Contribution Scores. This statistic is comprised of two values that identify the significance and overall impact of the dimension item with respect to the anomaly. Scores vary from -1, the strongest negative association, through 0, a weaker significant association, up to +1, the strongest positive association. By default, only statistically significant items are displayed, so all of the contributing items are worth inspection. Here are some tips for interpreting Contribution Scores:
- Generally, contribution scores further from 0 that have a higher proportion of the anomalous metric analyzed are the most interesting
- When you analyze a metric that dipped, negative contribution scores indicate significant dips in these items
- Always crosscheck high-contribution scores with metric totals to determine relevance. Review contributing items in the Contribution Drilldown table to see if there are contributing items with lower contribution scores but high metric totals…these may be quite valuable clues.
Top Segments
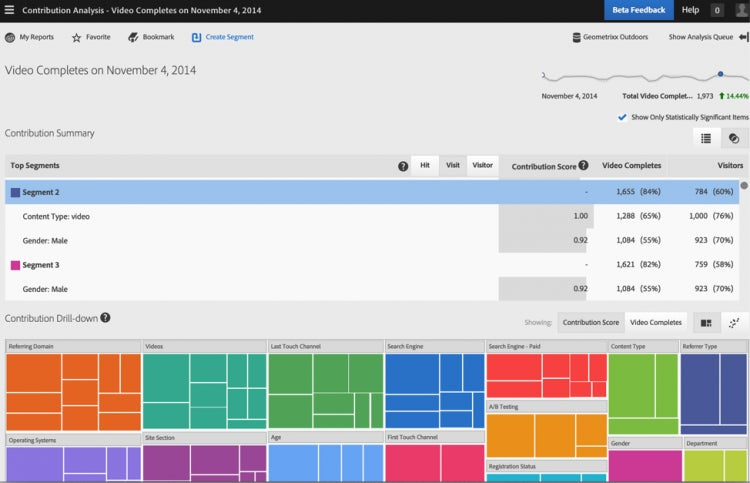
The final component to your Contribution Analysis super-lever relates to an exciting feature of Contribution Analysis called Top Segments. This analyzes and uncovers the overlap, or intersection, of the contributing items, forming segments for you. You access the Top Segments by clicking on the overlapping circles icon at the top right-hand side of the Contribution Summary. Select a contributing segment from Top Segments and click “Create Segment” to save it for segmenting reports and optimization (see Figure 5).
- To get more valuable from top segments, hide uninteresting items from the five Top Items table
- Item overlap for these new “segments” can be calculated at the hit, visit, or visitor level. Try calculating top segments at the Visitor level if there were many visits per visitor on the day of the anomaly.
- Top Segments identifies the intersection between items, equivalent to an AND statement between items
- Within the Analytics Segment Builder, try changing the definition to an OR statement to expand your potential audience size.
- In the Segment Builder, add the anomalous metric you analyzed for Contribution Analysis to the segment definition you added from Top Segments. If you want your segment to include those that completed the metric event on the day of the anomaly, then create an AND rule for the metric with a “exists” statement. If you want to find people that look like those that contributed to your anomaly but have not yet completed the metric event, add the same AND rule for the metric with a “does not exist” statement (expanding your audience).
http://blogs.adobe.com/digitalmarketing/wp-content/uploads/2015/03/jb2.png
Figure 5. Contribution Analysis lets you create and save custom segments for later reporting and optimization.
Next, Take Action!
Your next steps from Contribution Analysis may include:
Reporting:
- Apply segments to regular reports
- Collaboration – share your findings in the Marketing Cloud or via PPTX or email
Analysis:
- Create segment for deeper analysis in Reports & Analytics
- Use top items as inputs clustering, decision trees, and predictive modeling
Personalized Optimization:
- Create segment to activate an audience for Marketing Cloud optimization
Operations Improvement:
- Improve data collection or tagging
A Final Word on Understanding Your Limitations
Even demigods, titans, and gods had their limitations, and guess what, so do you! Remember that you don’t know what you don’t know! In terms of Contribution Analysis, the key contributor to your anomaly may be something you don’t track within Adobe Analytics. For example, you may know you’ve experienced an anomalous number of hits on your error page, but if you’re not tracking the finer detail of those errors via an error code in a prop, Contribution Analysis can’t tell you what caused the error.
Nils Bohr, a Nobel-prize laureate, famously said, “Prediction is very difficult, especially if it’s about the future.” You can never know in advance all the variables you’ll need, so track as many as you can think of, reducing the probability that your lever slips off its fulcrum and injures you.