Measuring TV Audiences with Science

Measuring TV Programming and Commercials Across Screens
Multiscreen metrics have become increasingly important for TV programmers and distributors to examine due to the fact that consumers are increasingly dividing their attention between traditional TV and streaming video options across smartphones, PCs, tablets, and TV connected devices. This article outlines viewing trends based on the latest research and provides a framework for companies to measure viewing of their own content across screens. The framework encourages companies to consistently gather multiscreen insights on an ongoing basis in order to have a fail-safe approach to measuring TV programming and commercials across screens.
Viewing Time is Going Up on Connected Devices
Before Apple TV and Roku brought premium video to the living room in a big way, viewing time on connected devices was a miniscule sliver of the overall viewing pie. By 2014, this sliver grew to command a double digit percentage share of viewing time.
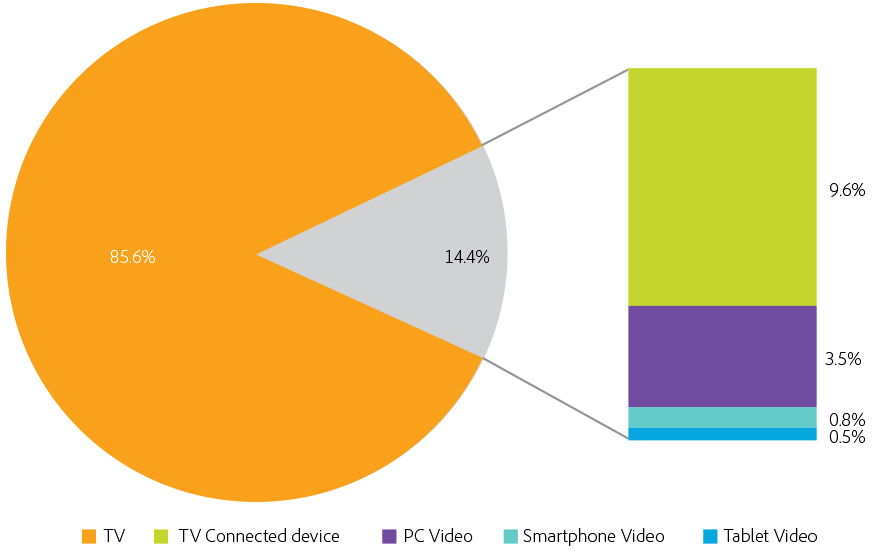
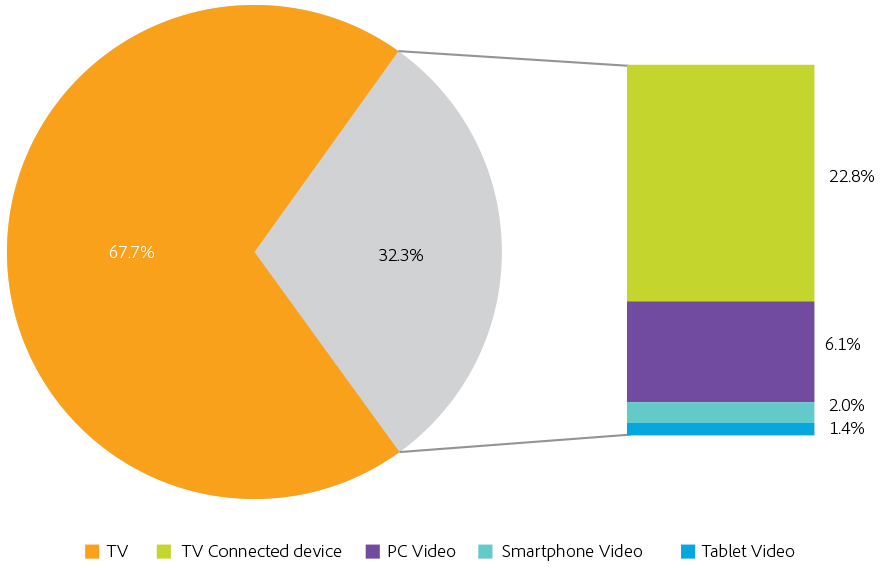
In 2015, the share of viewing time on connected devices increased further. For an average week in July 2015, 14.4% of viewing time among all adults (18+) happened on connected devices. In addition, an even greater 32.3% of viewing time among young adults (18-34) happened on connected devices.
Not surprisingly, viewing time on TV connected devices makes up the bulk of the digital consumption trend. 9.6% of viewing time among all adults (18+), and 22.8% of viewing time among young adults (18-34), happened on a TV connected device.
14.4% of Viewing Time Among Adults 18+ Took Place on a Connected Device in July 2015
https://blog.adobe.com/media_d0b0c3244244e5886055bf0a4823a91f3871b2a2.gif
Source: Data compiled from page 9 of Nielsen’s “Comparable Metrics, Q3 2015” report, published on January 6, 2016.
32.3% of Viewing Time Among Young Adults 18-34 Took Place on a Connected Device in July 2015
https://blog.adobe.com/media_b28752bcbcb41ea2508c0206ce0ece976eea9bdb.gif
Source: Data compiled from page 11 of Nielsen’s “Comparable Metrics, Q3 2015” report, published on January 6, 2016.
Indications of Continued Growth in Digital Viewing
All signs indicate that viewership on connected devices will be the engine for growth in overall television programming consumption. For example, the number of pay-TV households using TV Everywhere is up by 7% YoY to approximately 13.7 million subscribers while the number of pay-TV households not using TV Everywhere is down by 1.7% YoY to approximately 88.5 million subscribers.
7% Growth in Pay-TV Households Using TV Everywhere; 1.7% Decline in Pay-TV Households Not Using TV Everywhere
https://blog.adobe.com/media_6a42d271ac31c6fd49cd90d39719dfa18fa21faf.gif
Source: Estimates based on data from “Digital Video Benchmark: Adobe Digital Index Q3 2015” published by Adobe in December 2015 and from “US Pay and Non-Pay-TV Households, by Type, 2014-2019” published by eMarketer in December 2015.
Household data also shows a 6.7% YoY growth in households without pay TV. However, these aren’t necessarily households that won’t pay for television programming. Parks Associates reports that 8.4 million households subscribe to broadband internet and at least one over-the-top (OTT) video service, but do not subscribe to pay TV. That leaves approximately 12.4 million households that don’t pay for programming at all. This non-paying group may still consume free, ad-supported video services such as YouTube or Sony Crackle.
Impact of Digital Viewing on TV Advertising
Video advertising that is placed in full-length, TV-quality programming and delivered over broadband is going to be huge. TDG Research calls this form of advertising “OTT TV advertising” and says it will account for approximately $40 billion in spend by 2020 in the U.S., which is just under half of 2020’s projected $85 billion in total TV ad revenue. If there’s one stat that highlights the need to measure TV programming and commercials across screens, it’s this one. For the average TV programmer or distributor, this means that half of TV ad revenue will come from viewing activity across smartphones, PCs, tablets, and TV connected devices.
A Framework for Measurement
https://blog.adobe.com/media_5e59fd2981b7d06c33414950c96368482a838a8b.gif
TV programmers and distributors need a measurement framework that covers three key areas: video analytics, audience analytics and comparable metrics.
In the first key area, video analytics provides insights into video consumption for TV programmers and distributors. It can be used to answer very specific questions about what’s happening with video consumption, when it’s happening, why it’s happening and where it’s happening.
In the second key area, audience analytics provides insights into viewing audiences for TV programmers and distributors. It can be used to answer very specific questions about how different viewing segments are engaging with video programming.
In the third key area, comparable metrics provides a baseline for what media buyers need in order to figure out what TV advertising to buy and how much it should cost. This baseline may include reach, frequency and duration metrics. The more these metrics are universal, the better they can serve the industry. They tend to help the most when they come from an audited, accredited source such as Nielsen or Comscore.
Let’s explore each of these three key areas more closely.
Video Analytics
Census-based video analytics can be used to measure video initiates, video time spent, completion rates, average time on video, ad starts, ad time spent, average ads per video, time spent on ads, and more. It can also measure quality of experience (QoE) data concerning bitrates, errors, buffering, and so on.
Video analytics makes this data available for deep analysis by teams across an organization, such as video ops or sales teams. For example, ad ops teams can use QoE data to optimize for high quality experiences or sales teams can add engagement metrics to their pitch.
What’s even more powerful about video analytics is the ability to combine it with other data, such as audience analytics.
Audience Analytics
Audience analytics is another area where census-based measurement adds significant value.
It allows TV programmers and distributors to evaluate audiences from a multitude of angles, to segment audiences, and to take different actions with different segments. A TV programmer might package and sell one segment very differently than others. Or, it may communicate and market itself to one segment very differently than others. These actions all become possible when TV programmers have census-based audience analytics.
In fact, data is creating entirely new ways to sell TV advertising in ways that resonate with advertisers. All methods of data-driven targeting are becoming available in OTT TV advertising, such as retargeting, affinity targeting, behavioral targeting, location-based targeting, look-alike modeling and more. The targeting is really only limited by the data that’s used to define the target.
It’s very useful to be able to consider audience traits against other types of data. For example, companies like Rentrak and ListenFirst have innovative benchmarking data that can help media sellers tell a compelling story about the value of their inventory.
Rentrak’s Stickiness IndexTM provides a way to compare how committed an audience is to one linear program versus all other programs. It does this by comparing the average percentage viewed of each telecast to that of all telecasts. A score of 100 indicates typical levels of commitment to a program; a score above 100 indicates above average levels of commitment; and a score below 100 indicates below average levels of commitment.
ListenFirst’s Digital Audience RatingsTM for TV (DAR-TV) provides a way to compare the volume of online activity generated by one program versus the volume generated by other programs, on a daily basis. It looks across six distinct digital channels — Facebook, Instagram, Tumblr, YouTube, Google+, and Wikipedia — and aggregates the daily volume of engagements for shows from over 80 programmers and for all OTT originals. DAR-TV rolls all this activity up into one number that represents the volume of online activity for a show.
TV programmers and distributors may find a sales sweet spot by layering audience data over benchmarks like the Stickiness IndexTM and DAR-TV. For example, an advertiser may be willing to pay a premium for a Millennial audience across shows with high stickiness (as determined by Rentrak’s Stickiness IndexTM) that also spark a lot of online engagement (as determined by ListenFirst’s DAR-TV). The pieces are rapidly falling in place for TV programmers and distributors to do this.
Clearly, the data used to analyze TV programming and commercials can come from many informative and influential sources. At least some of these sources should approach universal acceptance. That’s where the third key area of the measurement framework comes in. It calls for comparable metrics that make it easy to compare and contrast opportunities across screens.
Comparable Metrics
Nielsen’s at the forefront of providing comparable metrics. In December 2015, it began rolling out a highly-anticipated measurement tool called Total Audience Measurement. Users of this solution will be able to compare and contrast reach, frequency and duration metrics for traditional TV, DVR, video-on-demand (VOD), connected TV, computer, and mobile devices in one place.
Total Audience Measurement will produce insights at the programmer- and distributor-level that Nielsen’s recent “Comparable Metrics: Q3 2015” report has done at the industry level. It answers three key questions. First, how many people engage with TV programming? Second, how often do people engage with TV programming? Third, how long do people spend with TV programming?
How Many People Engage with TV Programming?
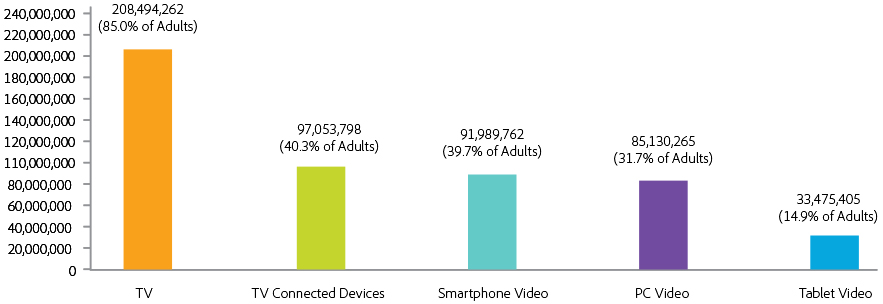
To measure how many people engage with TV programming is to measure reach. Reach accounts for the number of people that watch in a given period of time. Figure 1 shows that 85.0% of the adult population can be reached with TV, 40.3% with TV connected devices, 39.7% with PC video, 31.7% with smartphone video, and 14.9% with tablet video. These numbers are important because they provide an upper end ballpark for how many people per week could watch any given show on each screen.
Weekly Reach by Screen Among U.S. Adults 18+
https://blog.adobe.com/media_1c04c4e7a8bd665ad3652f81de281145bec0feca.gif
Source: Data compiled from page 9 of Nielsen’s “Comparable Metrics, Q3 2015” report, published on January 6, 2016.
How Often Do People Engage with TV Programming?
To measure how often people engage with TV programming is to measure frequency. Frequency is an important thing to measure because it’s a core component of time spent. If a TV programmer wants to increase time spent metrics among its viewers, it either needs to increase the average frequency of viewing or increase the average duration of viewing.
One specific way to measure frequency is to study the average days per week with TV or video viewing usage. The figure below shows that U.S. adults watch the TV screen more frequently than any other screen.
Average Days per Week with Usage by Screen Among U.S. Adults 18+
https://blog.adobe.com/media_91ee446843f1ed46587d4b7f3390556575442ba4.gif
Source: Data compiled from page 9 of Nielsen’s “Comparable Metrics, Q3 2015” report, published on January 6, 2016.
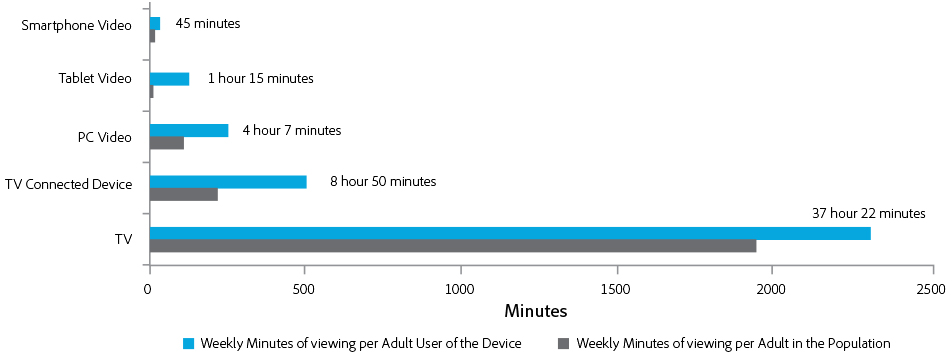
How Long Do People Spend with TV Programming?
To measure how long people spend with TV programming is to measure duration. Measuring duration is important for all the same reasons that it’s important to measure frequency. It’s a critical component of time spent metrics. If millions of people watch TV programming for very short durations of time, then time spent metrics will be very low. Viewers need to be engaged and sticking around to watch for hours, not just minutes.
In the U.S., time spent viewing TV is still larger than time spent with all other video viewing vehicles combined. According to Nielsen, TV delivered 458 billion minutes of viewing during an average week in July 2015 versus 77 billion minutes of viewing across all connected devices during the same period. However, growth in device ownership and viewing behaviors on connected devices may quickly change the viewing landscape.
Weekly Minutes of Viewing by Device Among Adult Users Versus Adult Population
https://blog.adobe.com/media_b9828b1a2121cc60d36e737718f5b089b6a3c962.gif
Source: Data compiled from page 9 of Nielsen’s “Comparable Metrics, Q3 2015” report, published on January 6, 2016.
Another reason duration metrics are so important is that people only have about 16 waking hours a day to spend doing things. For the most part, audiences have maxed out the amount of time they have to spend with viewing programming. The pie for any given individual’s viewing hours is fixed. As a result, viewing duration is a highly competitive measure. When audiences have only so many hours to spend with TV programming, TV programmers and distributors must compete for attention.
Using Data to Plan for the Future
For a fail-safe approach to measuring TV programming and commercials across screens, TV programmers and distributors need access to all the key areas of measurement insights: video analytics, audience analytics and comparable metrics. Video and audience analytics can be used to answer just about any question that a business may have about its own video consumption and viewing audiences. Then, comparable metrics helps TV programmers and distributors give media buyers what they need to make media buying decisions.
Get Video and Audience Analytics with Adobe Products
The Adobe Marketing Cloud makes it easy for TV programmers and distributors to extract insights by automatically collecting and surfacing the data that’s essential to a successful multiscreen programming strategy. Data within the Adobe Marketing Cloud is fully actionable. If a TV programmer or distributor wants to use the data to improve its cross-channel marketing execution, optimize the viewer experience or improve its sales strategy, it can.
Understand the TV viewer and learn more here.