How Hot Shopping Tips Led to a New Way to Track the Economy

https://blog.adobe.com/media_962e8f8c3c462775d7ddc8cc1a48e93982427270.gif
It was a modest question that led to a new way of tracking the U.S. economy. The Adobe Digital Index team was sorting through aggregated, anonymous data about online spending, gathered from Adobe’s Marketing Cloud, to report on holiday shopping trends. Then they wondered: could they look at specific products to tell consumers when to get the best deals?
This is when Luiz Maykot, data science analyst, Digital Index, got really excited. He dug into the massive pile of data and, with “a little bit of luck and a little bit of ‘I’m stubborn and I know we can do this,’” he figured out how to get down to the granular level of individual goods. The resulting 2014 report was a huge hit with consumers, but the team didn’t stop there.
Luiz and his colleague Tyler White, senior manager, Digital Index, were both economics majors in college, so they sensed that they’d stumbled onto something much bigger than a hot holiday tip. If they could measure the prices and quantities of specific goods as they’re sold online, there was a chance they could create a new, robust metric for tracking inflation in the United States. The standard measure, the Consumer Price Index (CPI), is based on painstaking, slow work—government researchers visit stores to examine and compare prices, and they combine their findings with a consumer survey conducted every four years. This means the CPI has two major drawbacks: there’s no accurate way to account for the quantities of goods consumers buy at different prices, and by the time the numbers are published, the data is already out-of-date. Luiz and Tyler, on the other hand, had the missing ingredients—up-to-date pricing data with the quantities of goods consumers were buying. The Digital Economy Project was born.
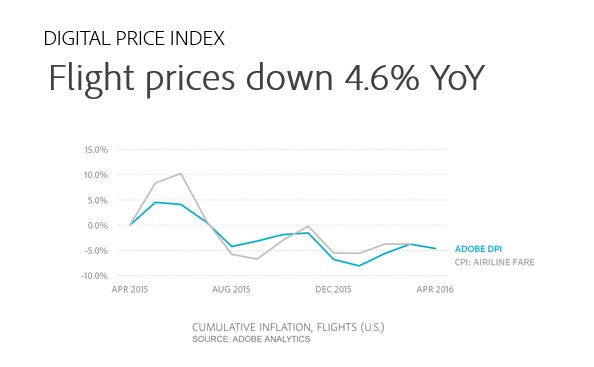
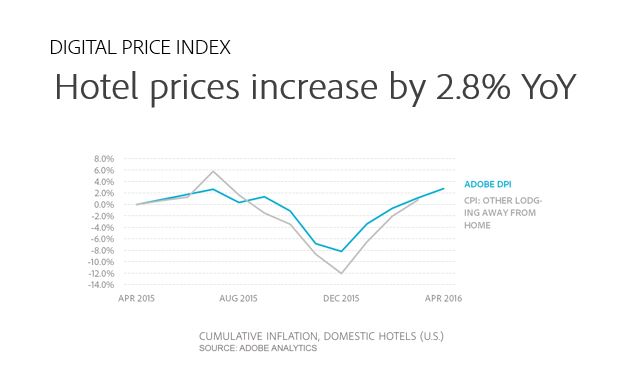
Last July, the team reached out to a few of the top economics professors in the U.S. and developed long-term relationships with Dr. Austan Goolsbee of the University of Chicago and Dr. Pete Klenow at Stanford. “They never thought of Adobe as big data company. They were like, ‘Where have you been?’” Luiz recalls. “We’ve been working with them ever since on defining the methodology.” The professors steered Tyler and Luiz toward the gold standard of pricing indices (the Fisher Ideal Price Index), and helped them figure out how to apply their data to the model. https://blog.adobe.com/media_093c9adcc7e5b9635419c0e7559bcd9dad5b3297.gifSo far, the team has rolled out three key indices for understanding the U.S. economy: The Digital Price Index, which looks at inflation through electronics and grocery products sold online, drawing on data from 8 billion website visits and 1.4 million products sold online between January 2014 and January 2016; the Digital Housing Index, which examines trends in the housing market based on online visits to U.S. housing-search websites; and the Job Seeking Index, which reveals trends in digital job-search behaviors based on 1 billion visits to U.S. job-search websites. In a new report released this May, they’ve added data about flights, hotels and sporting goods. Among the results: thanks to low fuel prices, flight prices are down 4.6% year-over-year (YoY), but hotels are busier and room prices are up 2.8% YoY.
https://blog.adobe.com/media_bdcd426f98137724f37a7c9a66bab0a5b4a243cf.gif
https://blog.adobe.com/media_8df12cd5d5d99fb9ad944174db65916f9c90099c.gif
The indices provide intriguing new perspectives on how our economy works. For example, the team has real data about substitution—as the price of a good goes up, they can track when consumers shift toward a cheaper alternative. Substitution is a fundamental concept in economics, but no one’s been able to measure its effects on price fluctuations at the scale that Adobe can.
There are also insights about inflation overall: “In general, I think there’s a perception that prices are going up all the time, that consumers are just getting beaten down. But that perception often doesn’t take into account how quickly consumers find and adopt new options,” Tyler says. “Even though your new smartphone may cost you more than your old phone, the reality is that it’s also replacing other things you used to buy or want. Since we now can see the quantity of each product purchased we know how much consumers substitute in response to relative price changes. That can’t be done with a fixed basket approach and when we account for that substitution, we see that prices aren’t inflating as fast as traditional numbers have shown in some categories, or even deflating more quickly than previously reported. That’s surprising to a lot of people.”
So far, the group is amazed by the wide range of people who’ve responded. The U.S. Bureau of Labor and Statistics (BLS) is interested in ideas for modernizing their methods, and the Office for National Statistics (ONS), the U.K.’s equivalent to the BLS, has also reached out. The team has also heard from analysts on Wall Street who are thrilled with the new insights into consumer trends.
“The world realizes that big data is here to stay, and there’s a lot of value in it. The reality is the government spends about a quarter of a billion dollars a year to measure inflation, and Adobe’s been doing it with a very small team. It’s much cheaper to use big data than it is to send physical people to collect prices in stores, and having quantities is important. No one has ever had that data,” explains Luiz.
Adobe customers have also been excited about the indices, asking for deeper dives into specific product areas. The numbers could help marketers understand overall industry trends, and tease out the differences between their own sales and industry-wide shifts. As Luiz notes, marketers know that “there’s a lot of room in digital marketing data to do a lot of things besides measuring engagement rates, visit rates, or conversion rates.”
Of course, since the Digital Economy Project measures online consumer activity, the team is keenly aware of how their sample might skew the data—not everyone has access to online commerce, and some products still aren’t usually sold online. But the impact of digital-only data might be smaller than you’d think. In March, a professor from MIT published research showing that online prices and offline prices in the United States are very similar—69% of the time, prices are identical. When there are differences, the average is only about 1%. The Digital Economy team is already thinking about how they might incorporate the MIT data to explore what happens to online sales quantities when offline prices rise or fall.
And for those economic activities that are still mostly offline—consider home and car purchases or searching for a new job—the team is investigating how online behavior (where consumers look and how often) might be a good proxy for what’s going on offline.
Over the next year, the Digital Economy Project will get more granular about what’s included in the first three indices, and begin to divide data by regions. “Potentially, we’ll do some more analysis outside the United States,” adds Tyler. “This will allow us to compare inflation measures from country to country, which can be important from a policy perspective. We’ll be able to see, in an apples-to-apples comparison, how different policies are impacting economic indicators.”
“We can look deeper and deeper,” Luiz muses, “and I think that’s what’s so amazing about this project.”
_To learn more, check out the latest Adobe Digital Economy report and read the press release.
_