Elevating Creative Deliverables with Data Visualization: Cushman & Wakefield Adopts Esri Integration with Adobe

For Cushman & Wakefield, one of the world’s leading commercial real estate services companies, data visualization is a key storytelling tool that helps the company win new business and provide clients with decision-making insight and support. What began as a small family business in New York is now a commercial real estate company with a solid foothold across the globe, with 400 offices in approximately 70 countries employing 51,000 people.
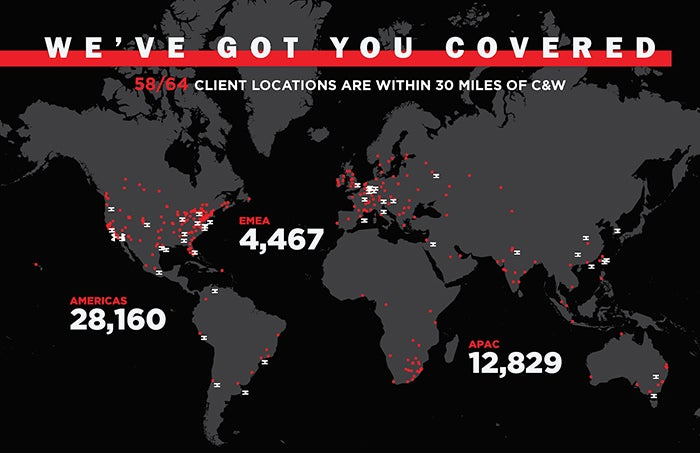
Cushman & Wakefield locations in relation to client locations map. Courtesy of Cushman & Wakefield.
Helping clients understand the data behind real estate decisions
Cushman & Wakefield delivers integrated real estate solutions to clients around the world. Those clients fall into two types: occupiers and investors. Occupiers are users of commercial real estate such as tenants of an office tower. Investors are owners of the real estate. So, whether a tenant is contemplating a new location for its growing business or an owner is looking to buy, lease, or sell a property, these decisions often have long-term implications and represent millions of dollars.
For both client types, understanding the data behind real estate decision drivers is crucial, given the stakes. In a world of increasing data and demand for decision-making support, companies like Cushman & Wakefield are challenged to find better, faster, and more efficient ways to help clients through data visualizations and storytelling. Enabling clients to peer around the corner and “see what’s next,” as the company might say, is foundational to Cushman & Wakefield’s success.
Modern tools for data visualization and storytelling
One way Cushman & Wakefield is solving the demand for data is through the adoption of Esri’s ArcGIS Maps for Adobe Creative Cloud. The company’s Adobe Creative Cloud users can now access Esri’s data-driven vector maps to produce quick-turn results, adding design elements and customizing each visualization with familiar tools. These Creative Cloud users are often graphic designers supporting the company’s many marketing demands.
The goal is greater capacity, efficiency, and productivity with an increase in creative control—and the results are paying off.
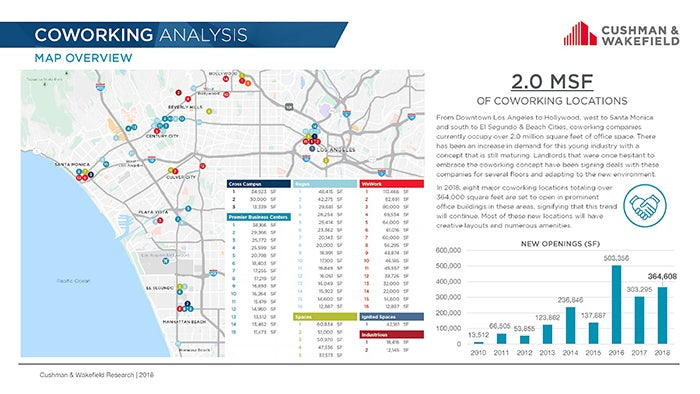
Coworking analysis. Courtesy of Cushman & Wakefield. Designer: Jiyoon Jung.
The example above, which was created using Adobe Illustrator, helps tell a succinct story around coworking, a trend in commercial real estate.
I recently spoke with Chelsea Gribble, Vice President of Business Development and Creative Strategy. Chelsea and a motivated team of early adopters at Cushman & Wakefield shared some of the challenges they faced prior to discovering the Esri integration for Adobe Photoshop and Illustrator. They also discussed how adopting the new solution has helped numerous groups across Cushman & Wakefield elevate their creative deliverables and use maps to tell their stories.
“Turning something complex into something easy to see and understand immediately—that’s a great tool to have in our toolkit. And through Esri’s data-driven maps and Creative Cloud, we are making that toolkit available to so many more people,” said Chelsea.
More than 120 professionals throughout the Americas region are now using Esri’s ArcGIS Maps for Adobe Creative Cloud. As the company continues to empower more team members across the region and the world to work this way, Cushman & Wakefield expects its ability to tell better data stories though mapping to grow. And with 51,000 employees in 400 offices in 70 countries, there’s plenty of room for growth.
“We hear from our sales teams all the time how critical this kind of map-based storytelling is when getting hired for assignments,” said Chelsea. “And once we’re hired, it still plays an important role in helping clients make great real estate decisions. It’s really exciting to be a part of that.”
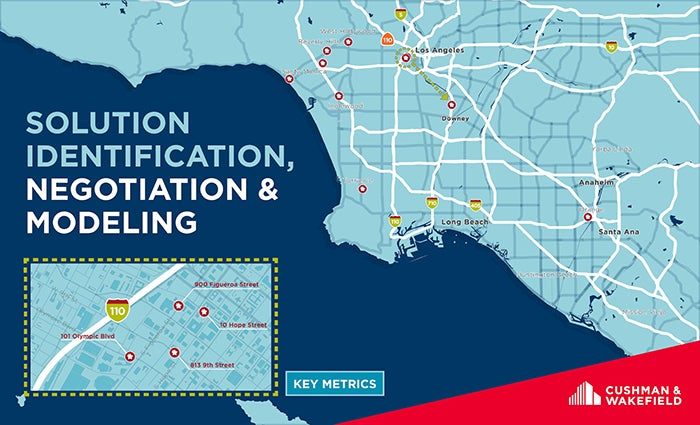
Consolidating properties to a single location map. Courtesy of Cushman & Wakefield. Designer: Myke Bailey.
Maps provide compelling visual design elements, but creating them can be difficult and tedious work, especially when content and data must combine with creativity to produce a compelling deliverable that tells a story. Regional Client Care Manager Diane Blaskiewicz explained that creatives often needed to find, buy, or draw their own maps and plot locations by hand in order to create the desired look and style. They were inundated with so many requests that a 3- to 5-day turnaround was common. It’s a time-consuming process that graphic designer Jiyoon Jung on the Americas Marketing team knows all too well.
“Before (Esri and Adobe integration), I would plot points in Google Maps, overlay in Adobe Illustrator, then hand draw where the locations are. It was a nightmare. I had to spend a lot of time on it,” said Jiyoon.
Getting Started with ArcGIS Maps for Creative Cloud
Using Adobe Creative Cloud with Esri’s ArcGIS Maps extension, commercial companies can now use maps in sales meetings, advertising, or to display brick-and-mortar locations. Meanwhile, educational institutions can share maps that highlight the reach of their ongoing research, and public sector and non-profit designers can communicate the impact of their services at a local, regional, or global scale.
Click here to learn more about the integration with Adobe Creative Cloud and how you can use data- driven maps to tell your own creative stories. If you are ready to give it a try, download it from the Adobe Exchange marketplace. Once installed, you can launch the panel from the main menu (go to Window/Extension) in Adobe Illustrator or Photoshop. There’s complimentary access to public ArcGIS Online content and support for basic features.