Adobe Digital Price Index: Online prices up 1.9 percent in October, as holiday discounts weaken

With offline prices surging however, e-commerce remains the better option for cost savings this holiday season.
The holiday shopping season began earlier this year (a month to be exact). Retailers, anxious about supply chain challenges, began pushing out a wave of early deals in the middle of October 2021. The discounts were enticing enough, that consumers spent over $72 billion online for the month — 8 percent more than last year per Adobe data. However, despite the early deals, discounts were not deep enough to curb the inflationary environment in e-commerce. As we get into November and December, where Adobe expects as much as 25 percent of holiday spending to happen online, consumers will see their dollars go less far. Despite that however, online shopping still remains a better option for saving money, as offline prices hit record highs per the latest Consumer Price Index (CPI).
In October 2021, online prices were up 1.9 percent year-over-year (YoY) and up 0.9 percent month-over-month (MoM) — per the Adobe Digital Price Index. It marks the 17th consecutive month of online inflation (first observed in June 2020). Consider that as a historical benchmark, prices in October 2019 were down 6.6 percent YoY going into the holiday season. With elevated pricing levels, discounts needed to be bigger (than last year) to make up the difference. That was not the case in categories like electronics and appliances.
Looking at prices on Nov. 6 (relative to Oct. 1), discount levels for electronics are at 8.7 percent — below the 13.2 percent level at the same point last year. In sporting goods, discounts are at 2.8 percent (vs 11.2 percent last year) — Appliances are at 4.6 percent (vs 10.2 percent). In a category like tools and home improvement, discounts are even weaker: Prices are up 1.2 percent compared to a 6.8 percent discount last year. These smaller deals minimized the impact of larger discounts in categories like toys (15.9 percent vs 7.5 percent last year) and computers (12.4 percent vs 11.9 percent last year).

Adobe Digital Economy Index: YoY change in online prices (18 categories tracked by Adobe).
And while goods are still cheaper online for several categories (the Consumer Price Index, which captures offline prices, rose by 6.2 percent YoY in Oct. 2021), e-commerce is not the safe haven it once was. The discounts have become smaller in major categories like electronics and computers, while a growing category like groceries, have prices that move more in tandem with what consumers see in stores. A once deflationary force in the economy has all but changed course, at a time when e-commerce is becoming increasingly ubiquitous: Adobe now expects $1 in every $4 to be spent online this holiday season, up from $1 in every $5. Underpinning this remains the persistent supply chain challenges: In Oct. 2021, consumers saw over 2 billion out-of-stock messages online.
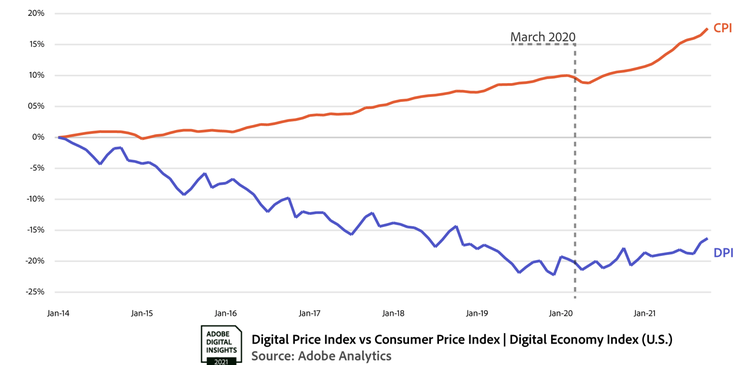
Consumer Price Index is profiled against Adobe’s data (cited as DPI for “Digital Price Index”).
“Consumers are now seeing a double hit to their pocketbooks, with everyday expenses like rent and gas rising, while the big holiday shopping season is going to get more expensive,” says Vivek Pandya, lead analyst, Adobe Digital Insights. “After 17 consecutive months of online inflation, we are entering a new normal in the digital economy. As e-commerce takes on a greater share of overall retail, the pricing trends have become a more important indicator of net impact to consumers.”
Individual Category Analysis
In the 18 product categories tracked by the Adobe Digital Price Index, all but one (books) saw higher prices online when indexed to a historical average (2015 to 2019). This was particularly notable in categories that see an uptick in spend during the holiday shopping season, such as electronics and apparel.
- In electronics, customers are seeing earlier but smaller deals. In Oct. 2021, prices were only down 0.60 percent YoY. Consider that as a historical benchmark, from 2015 to 2019, electronics were typically down 9.06 percent on average each year. This marks the 19th month where electronics prices have fallen less than the historical average. Heading into the holiday season, the trajectory is unlikely to change, with supply chain challenges persistent for anything with a chip in it. Even on the big shopping days during Cyber Week, Adobe expects the deepest electronics discounts to be only around 22 percent, compared to 27 percent last year.
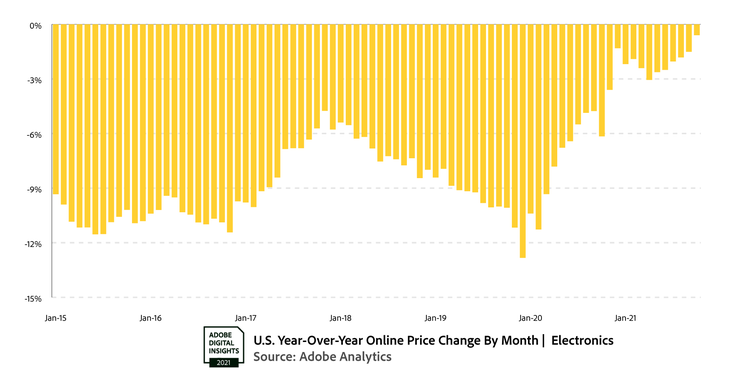
Adobe Digital Economy Index: YoY change in online prices for electronics.
- In apparel, prices have been elevated for 7 consecutive months, up 9.81 percent YoY in Oct. 2021. In the month prior (Sept. 2021) online prices were up even more at 17.27 percent YoY. This is an unusual trend for the category, and it has been driven (in part) by manufacturing disruptions abroad. We see that across 18 categories, apparel has seen higher volumes of out-of-stock messages online. And while the category tends to be cyclical in nature, with sporadic discount periods that creates dips and spikes in pricing, the last several months have been elevated in an unprecedented fashion.
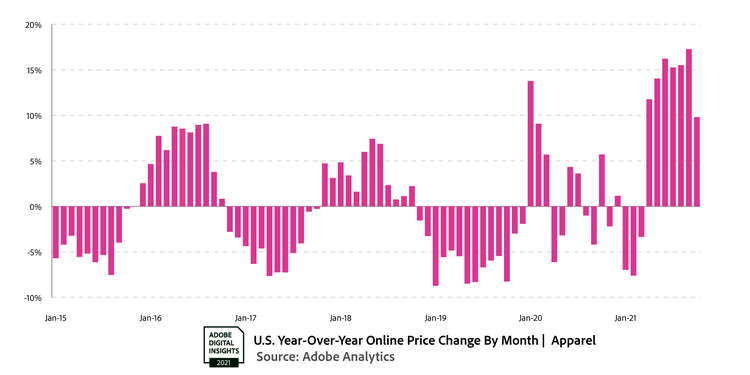
Adobe Digital Economy Index: YoY change in online prices for apparel.
- In toys, prices were down 2.71 percent YoY in Oct. 2021, with early holiday deals kicking in mid-October. It is still lower than the historical average however, where prices were typically down 5.54 percent each year. Similar to electronics, discounting is a hallmark of the toys category, but deals have steadily gotten weaker beginning in 2020. The trend is also unlikely to change: Demand is incredibly durable during the holiday season, just as supply chain issues intensify for toymakers.
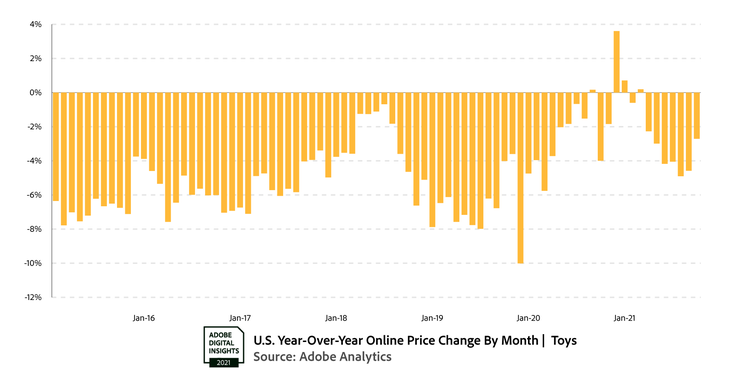
Adobe Digital Economy Index: YoY change in online prices for toys.
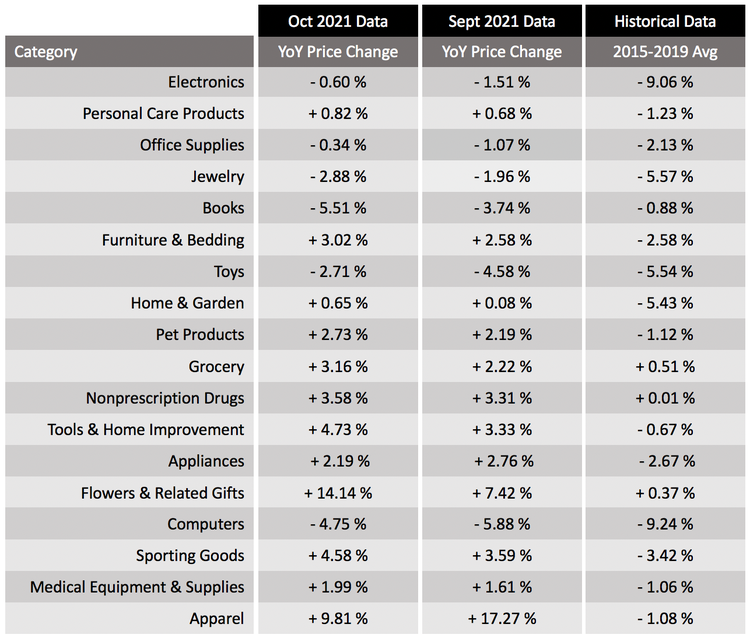
The full chart (YoY change in online prices) for the 18 categories is as follows:
Methodology*: The Adobe Digital Economy Index (DEI) uses the Fisher Price Index to track prices in the world of Ecommerce. The Fisher Ideal Price Index uses quantities of matched products purchased in the current period (month) and a previous period (previous month) to calculate the price changes by category. Adobe’s analysis is weighted by the real quantities of the products purchased in the two adjacent months. Powered by Adobe Analytics, the Adobe DEI analyzes 1 trillion visits to retail sites and over 100 million SKUs in 18 product categories. Adobe uses a combination of Machine Learning and manual effort to categorize the products into the categories defined by the CPI manual. The methodology was first developed alongside Austan Goolsbee and Pete Klenow.*
