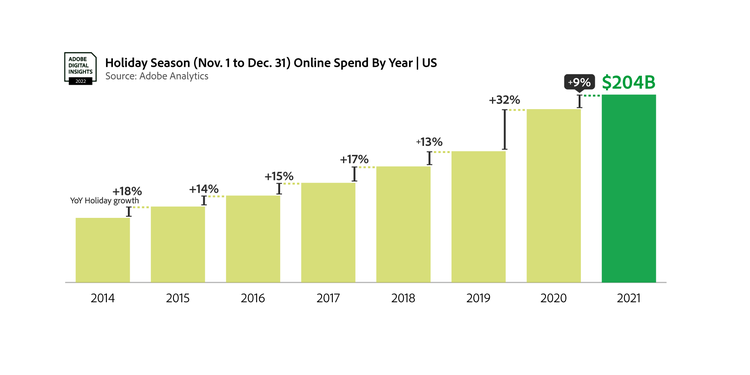
Adobe: U.S. consumers spent a record $204 billion online this holiday season

Adobe today released the final online shopping figures for the holiday season (Nov. 1 to Dec. 31). As part of the Adobe Digital Economy Index, Adobe provides a comprehensive view into U.S. e-commerce by analyzing direct consumer transactions online. Based on Adobe Analytics data, the analysis covers over one trillion visits to U.S. retail sites, 100 million SKUs, and 18 product categories — more than any other technology company or research organization.
Consumers spent a total of $204.5 billion over the 2021 holiday season, up 8.6 percent year-over-year (YoY). A record 38 days surpassed $3 billion in daily spend (25 days in 2020 by comparison), as consumers spread out their shopping outside of big days like Cyber Monday and began earlier — The weeks before Thanksgiving (Nov. 1 to Nov. 24) grew 19.2 percent YoY, while Cyber Week (5 days between Thanksgiving and Cyber Monday) was down 1.4 percent YoY. The weeks following (Nov. 30 to Dec. 31) grew 5.6 percent YoY.

Demand for online shopping was not deterred by persistent supply chain challenges, as retailers contend with congested ports, cargo delays, and disruptions in overseas manufacturing. During the holiday season, consumers saw over 6 billion out-of-stock messages online. This represents a 253 percent increase over the 2019 holiday season (prior to the pandemic) and a 10 percent increase YoY.
“This holiday shopping season was the first time where big promotional moments like Cyber Monday and Black Friday took on less of the spotlight,” said Taylor Schreiner, senior director, Adobe Digital Insights. “Like we saw during the Covid-19 pandemic, e-commerce has become a ubiquitous daily activity and a flexible way for shoppers to navigate product availability and higher prices.”
Discounts for the full season were weaker across major categories tracked by Adobe: In electronics, discount levels were at –8 percent compared to –21 percent in 2020 — Computers at –10 percent (vs –22 percent in 2020) — Appliances at –4 percent (vs –14 percent) — Sporting Goods at –6 percent (vs –14 percent) — Furniture/Bedding at –2 percent (vs –4 percent). Discount levels for televisions were unchanged YoY (-11 percent). Consumers did see bigger discounts in apparel (-13 percent vs –11 percent) and toys (-19 percent vs –14 percent).
Additional insights from Adobe Analytics include:
- Category Growth: This holiday season, online spending was driven by categories including toys (5.4 times more online sales, when compared to pre-season levels in Sept. 2021), video games (4.5x more), gift cards (3.6x more) and books (3.0x more). Other categories of note include groceries (2.7x more, driven by holiday meals), jewelry (2.2x more), electronics (2.2x more), baby/toddler products (2.1x more) and appliances (2x more)
- Top Sellers (Full Season): Top gaming consoles include Nintendo Switch OLED, PlayStation 5, and Xbox Series S/X. Top games include Call of Duty Vanguard, Battlefield 2042, Far Cry 6, FIFA 22, and Halo Infinite — Top toys include Baby Yoda products, Bluey products, Crystalina dolls, Gabby’s Dollhouse, and Got2Glow Fairy Finder. Top electronics and other devices include AirPods/AirPods Max, drones, record players, Samsung TVs, and LG TVs. Other top sellers include air fryers, Instapot, smart mugs, smart water bottles, and weighted blankets.
- Buy Now Pay Later (BNPL) saw double-digit growth this season, as consumers continue to try this emerging method of payment. Revenue was up 27 percent YoY while orders were up 10 percent YoY. On average, consumers are spending $224 using BNPL (per order), with roughly 3 items in the shopping cart. Growth has slowed however, signaling challenges for gaining mass adoption: When indexed to 2019, revenue was up 475 percent and orders were up 479 percent over two years.
- Curbside: For retailers who offer curbside/in-store pickup, the fulfillment option was used in 23 percent of all online orders this season. Despite the lack of growth (24 percent in 2020 and 22 percent in 2019), demand for curbside services remains durable — Shoppers likely value the convenience and speed, or find it to be a safe fulfillment option during COVID-19 surges. The day before Christmas Eve (Dec. 23), usage peaked at 40 percent. On average, curbside orders amount to $91 and roughly 2 items in the shopping cart.
- Mobile: Over the holiday season, 43 percent of online sales came via smartphones, coming in at $88 billion overall. It is a modest increase from 2020 (at 40 percent), as consumers still rely on desktop and laptop computers as the primary way to shop online. There were 6 days where over 50 percent of sales came via smartphones: 11/25 (Thanksgiving), 12/18 (Super Saturday), 12/19, 12/24 (Christmas Eve), 12/25 (Christmas Day), and 12/26. In 2020, only one day (Christmas Day) exceeded 50 percent.
Methodology: The Adobe Digital Economy Index offers the most comprehensive set of insights of its kind, based on analysis through Adobe Analytics that covers over one trillion visits to U.S. retail sites and over 100 million SKUs in 18 product categories — more than any other technology company or research organization.
